


Making Efficient Decisions with Correlation Analysis in SEO
In the projects I manage in SEO studies, I make decisions by taking advantage of the data of basic statistical science when appropriate. In this way, I can make data-based comments such as "I think it would be better to decide according to the analysis result instead of "let's do it this way" conversations as much as possible. In this article, I will explain how you can use correlation analysis in SEO with the simplest methods.
It would be useful to state the following in the introduction. It is difficult to determine which ranking factor has how much impact on the SERP so you can create decision-making processes with this in mind.
What is Correlation?
Correlation is simply a statistical measure of the relationship between two or more variables.
Sample Correlation Uses and Calculations in SEO Studies
Pearson correlation is a statistical technique that measures the linear relationship between two variables. In its simplest form, for example, it can be used to understand the relationship between clicks and impressions. The Pearson correlation coefficient takes a value between -1 and 1. A value of 1 indicates the best positive correlation, -1 indicates the best negative correlation and 0 indicates no correlation.
With clicks and Impressions data from Search Console, we can calculate the Pearson correlation between these metrics:
import pandas as pd
file_path = '/data/sc-verisi.xlsx'
data = pd.read_excel(file_path)
data.head()
# We calculate the Pearson correlation between 'Clicks' and 'Impressions'
pearson_corr = data['Tıklamalar'].corr(data['Gösterimler'])
pearson_corr
In the data I have provided as an example, the Pearson correlation coefficient between clicks and impressions is approximately 0.40. This result tells us that there is a moderate positive correlation between the two variables. In other words, as the number of impressions increases, the number of clicks also tends to increase; however, we can say that this relationship is not very strong. As you can see, you can use this as the simplest calculation method.
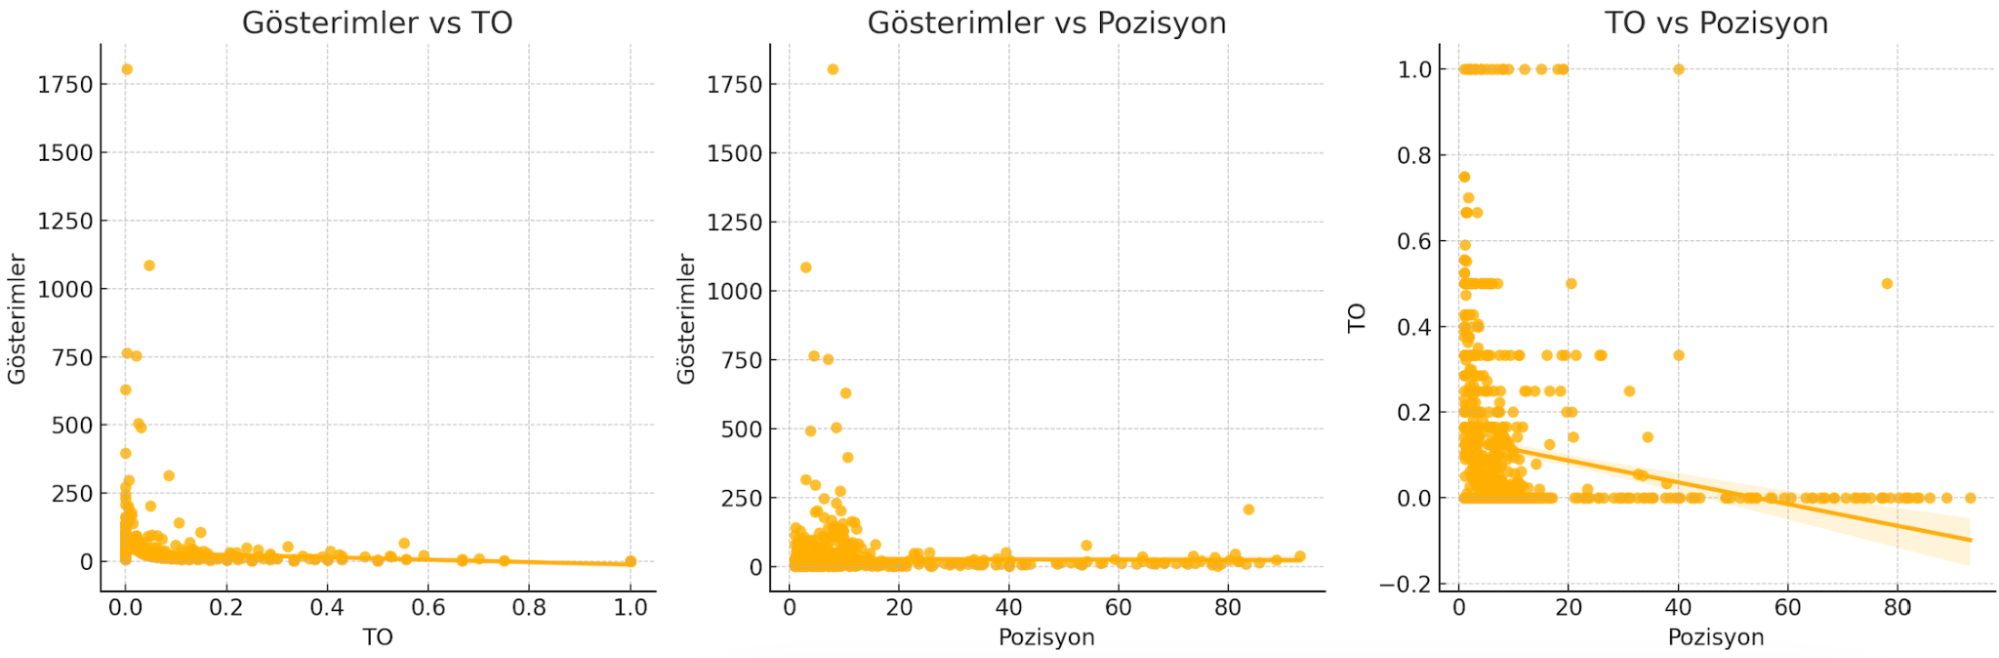
Understanding the correlation between clicks and impressions can help determine which pages need to be optimized. Let's calculate the correlation with other metrics:
CTR and Position:
Correlation -0.160
Comment: There is a weak negative correlation between the 2 metrics. CTR (click-through rate) increases slightly as the position improves, but this relationship is not very strong.
More statistical tests can be performed to determine whether these correlations are significant, but even this basic analysis method can provide you with useful information when determining your SEO strategies.
Not only with numerical values, but also with the graph you can interpret them more easily. The example charts below show the correlations between your Search Console metrics and their relationships simply and understandably:
I have shown with the examples above that you can do dozens of correlation analyses with SC data. Let's continue from Ahrefs this time and examine the correlation between the number of words (Words) and Domain Rating (DR) in the SERP for a word:
The calculation can be made with the formula below:
data_cleaned = data.dropna(subset=['Words', 'Domain rating'])
correlation = data_cleaned['Words'].corr(data_cleaned['Domain rating'])
correlation
In this example, the correlation between word count and DR is 0.17. This means that as word count increases, DR tends to increase slightly, but this relationship is very weak. Therefore, we can say that word count has no significant effect on domain rating. It is important to remember that there are other factors in SEO:
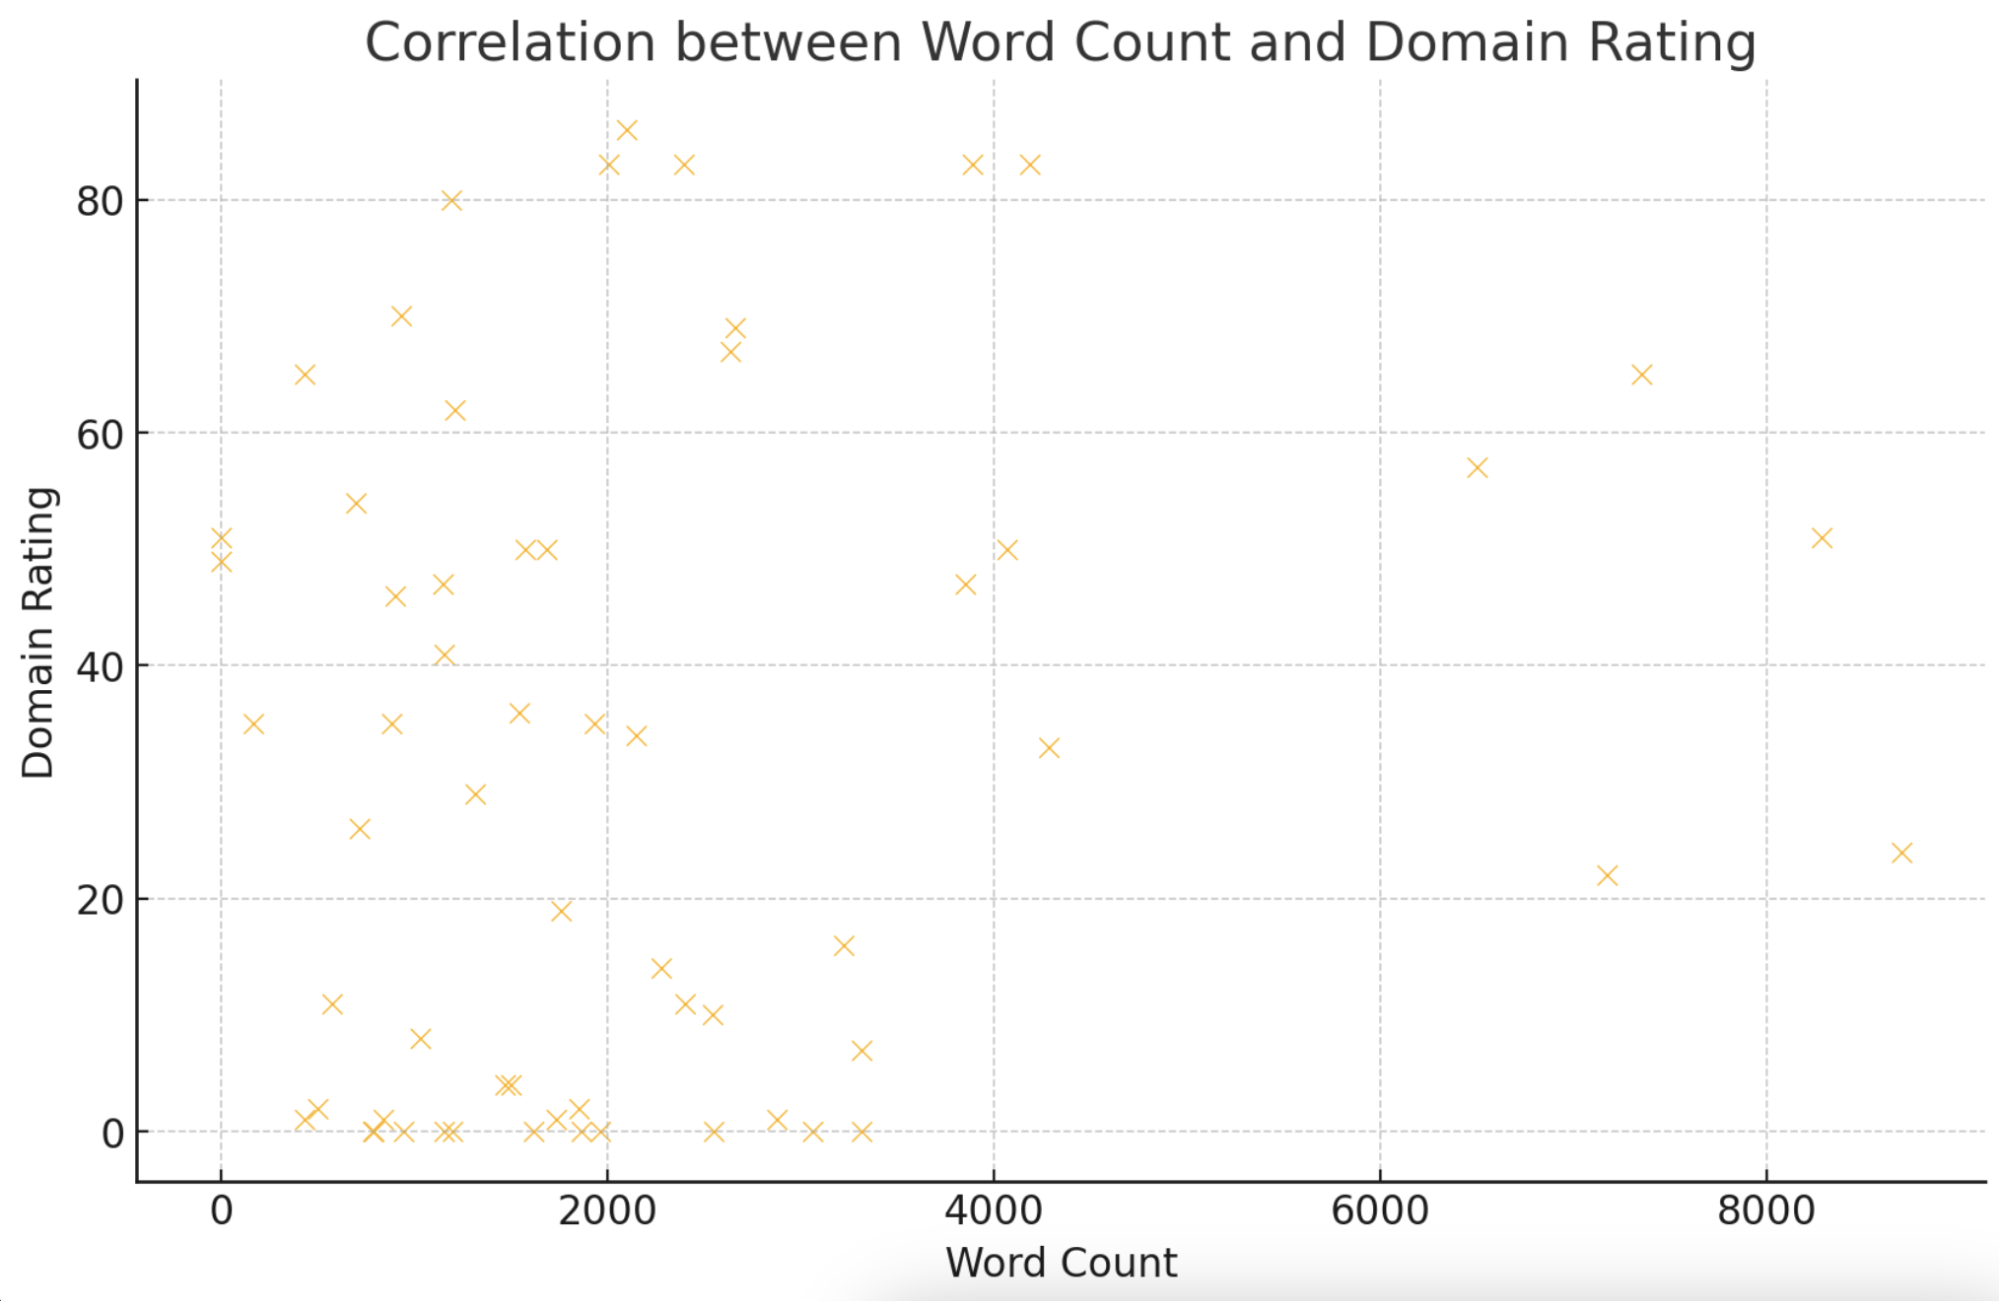
Results and interpretations may vary according to each SERP. You can diversify this analysis for your top words. The scatter plot I created confirms the weak positive correlation between these two variables. The X signs are scattered over a wide area in the graph and no clear trend is observed.
This time let's look at DR and position. According to my dataset, the correlation between domain rating and position is -0.23. This means that as domain rating increases, positions may improve, but this correlation is weak. DR can only influence the position up to a certain amount and of course, there are other factors:
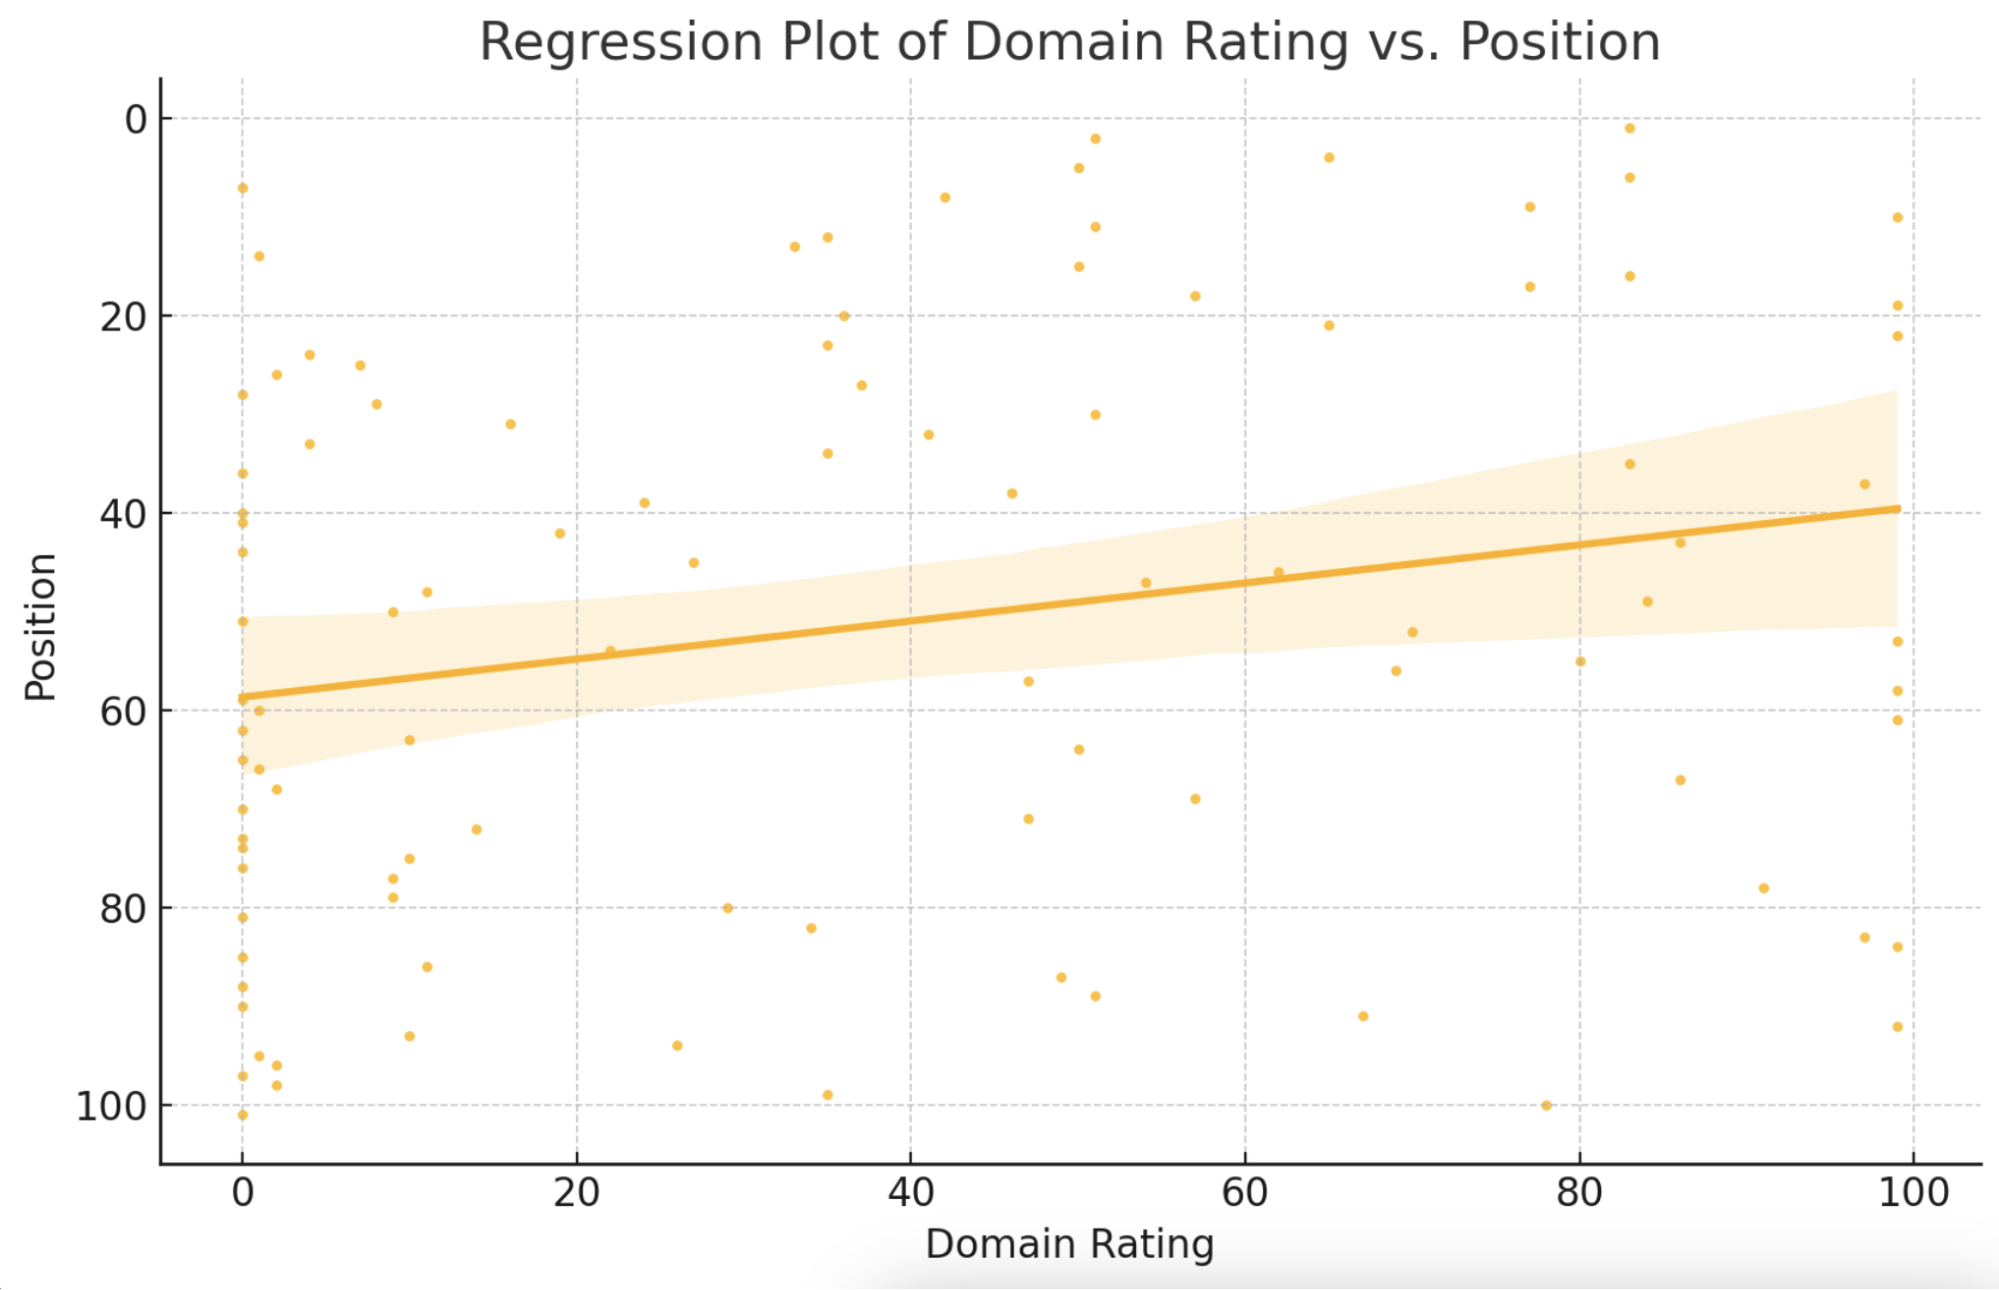
The regression chart above shows the relationship between DR and position. The trend line in the graph shows that as DR increases, the position improves.
If you want to use it in more niche areas, you can create a dataset larger than 30 and examine the relationship between the position of sites using <H1> for example.
Keyword Performances
I wanted to share a small statistical calculation method that you can use other than correlation and that I do frequently. I used data from my blog and continued my analysis with query data this time. According to my SC data, the word "thailand" was the keyword with the highest impressions with 1087 impressions; however, the CTR of this word is low at 4.69%. Accordingly, I can understand from this data that the related word may be highly competitive or that I need to improve the content.

“uefa ülke puanı hesaplama” ("uefa country score calculation") has a high impression count with 753 impressions, but a low CTR of 2.12%. I can create action plans to improve content quality for this keyword.
Some Situations in Correlation Analysis Specific to SEO
Once we understand the following complex situations, we can interpret correlation analysis more effectively. After looking at the correlation result, you need to use a little bit of your SEO experience:
Other Unknown Factors: Sometimes the correlation can be explained by another factor. For example, we can see a correlation between the number of keywords and the average position. This may not be because "word count" is included in the ranking factors, but because content with longer word counts tends to be more valuable.
In another example, we can see a correlation between the number of RTs X (Twitter) and position, but this does not necessarily mean that the number of RTs directly affects rankings. Very good content is often liked because it ranks well and may be shared more, especially in English.
SERP sample size: If you go and look at only 2-3 results in your SERP analysis, you can get misleading results. It is always better to analyze multiple results.
According to Fraenkel Wallen, the minimum acceptable sample size is at least 30. (n ≥ 30). He states that data from samples smaller than 30 may not reflect the correct correlation.
Time-dependent changes: When analyzing some data, it is important to keep in mind that time-dependent variables can affect rankings with a delay. For example, the number of newly acquired backlinks may take time to affect rankings because search engines may not detect these changes immediately.
You can interpret the results obtained from correlation analysis by combining them with SEO techniques and using them when making strategic decisions.


