


Comprehensive Microsoft Clarity User Guide for Website Analytics
To make your website development efforts more user-friendly, I'd like to introduce you to Microsoft Clarity, an analytics tool that helps you find and fix bugs and omissions on the website and provides tangible outputs aimed at improving the user experience.
What is Microsoft Clarity?
Microsoft Clarity is a user behavior and website debugging analysis tool. What Clarity does is provide insights into how users interact with the site. The way it presents the analysis is what makes Clarity completely different from other analytics tools, including Google Analytics.
While other analytics tools provide reports and data about traffic, keywords, page performance, etc., Microsoft Clarity focuses on the user experience to provide website owners with insights into how the user interacts with the website and to provide a tangible output from the records. This tangible user behavior data helps website owners identify areas for website improvement, find web page errors, and gain insights into conversions, among many other useful insights.
With Clarity, they can see patterns of user interaction on different parts of pages within the site and play back recordings of user sessions to learn how users interact with web pages.
All of these insights are provided by Microsoft Clarity in near real-time. With data such as how many minutes a user has been logged in, on which device, from which country, and for how long, the behavior of a live user or a logged-out user can be transparently analyzed.
Microsoft Clarity vs Google Analytics
While Google Analytics provides insights into traffic patterns, Microsoft Clarity provides actionable insights into how users interact with web pages.
Microsoft Clarity is not a competitor to Google Analytics. Instead, it complements Google Analytics to the point where you can connect it to Clarity and get more user behavior analysis using the imported data.
So, does Microsoft Clarity have limits and does it pose a concern in project integrations? With the following headings, we have included Microsoft's user concerns and the responses to these concerns.
Privacy Compliance
Although Microsoft Clarity tracks user behavior on the website, Clarity is fully compliant with EU GDPR and CCPA privacy requirements. To protect user privacy, Clarity minimizes the collection of personal data. There is no tracking of user identities or personal information. You can find detailed information here.
Impact of Microsoft Clarity on Site Speed
Microsoft Clarity's JavaScript is loaded asynchronously and, according to Microsoft, does not affect website performance.

How to Integrate Clarity?
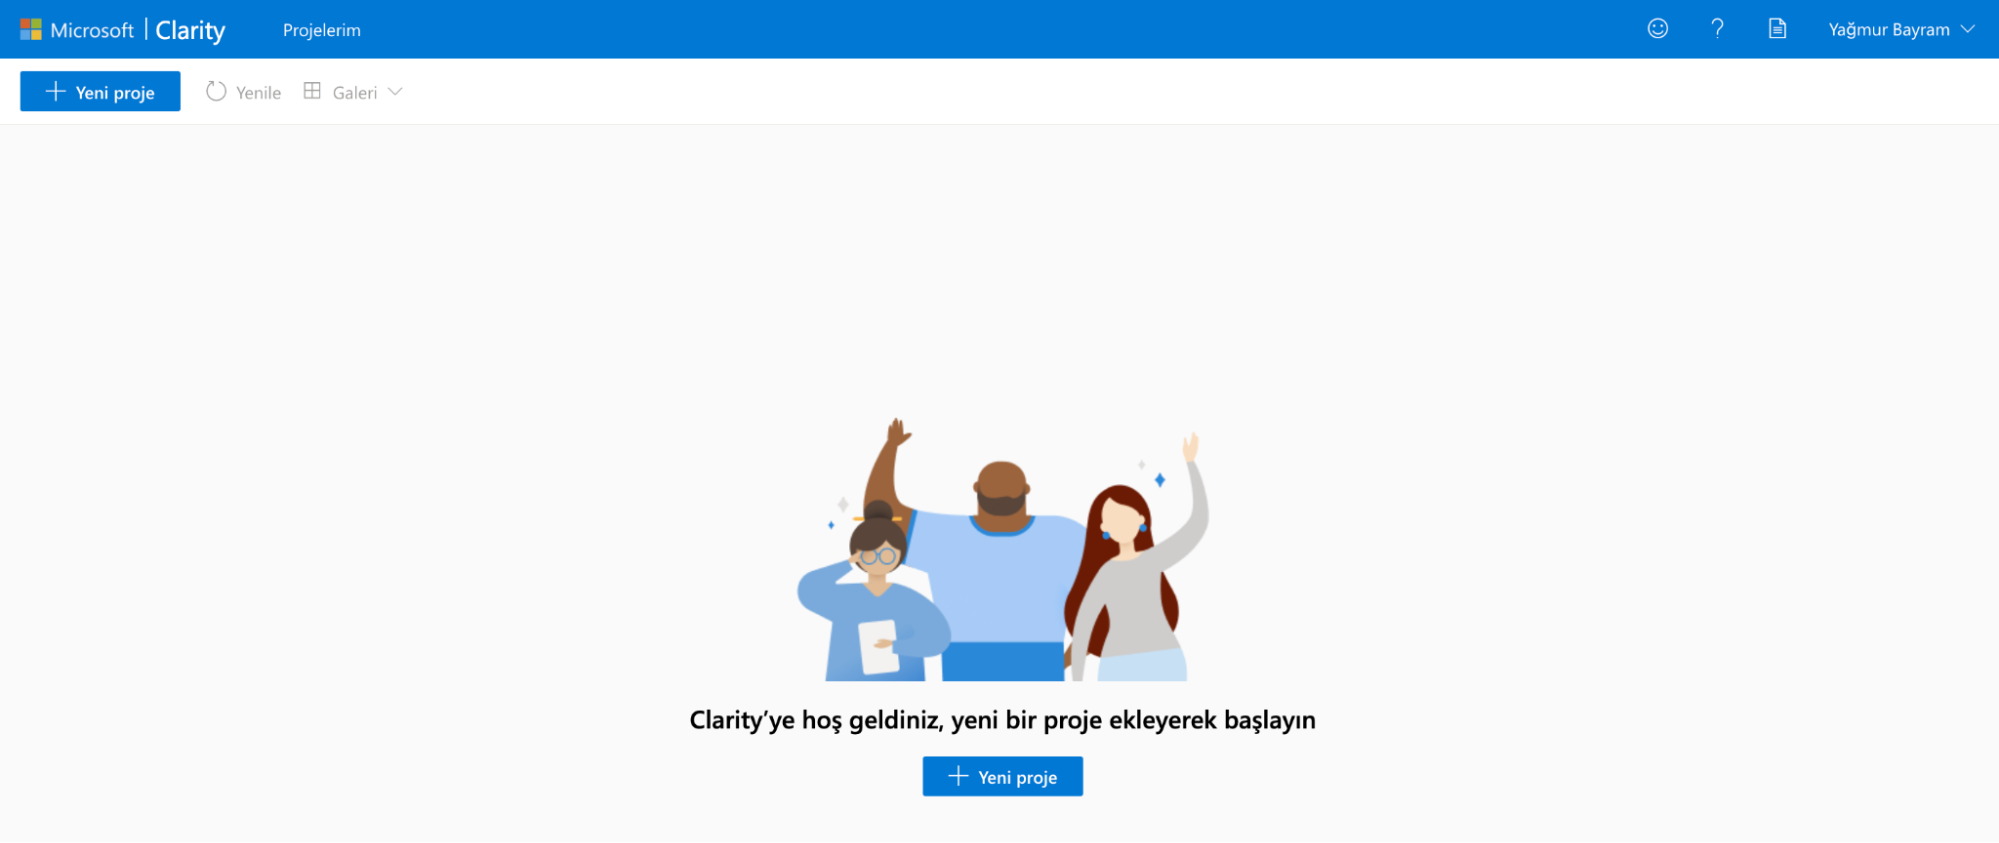
We can set up our project in Clarity by going through the same integration process with similar analysis tools. After logging in from the Clarity Home Page with an e-mail account, we start the project setup with "New Project" from the "My Projects" dashboard.
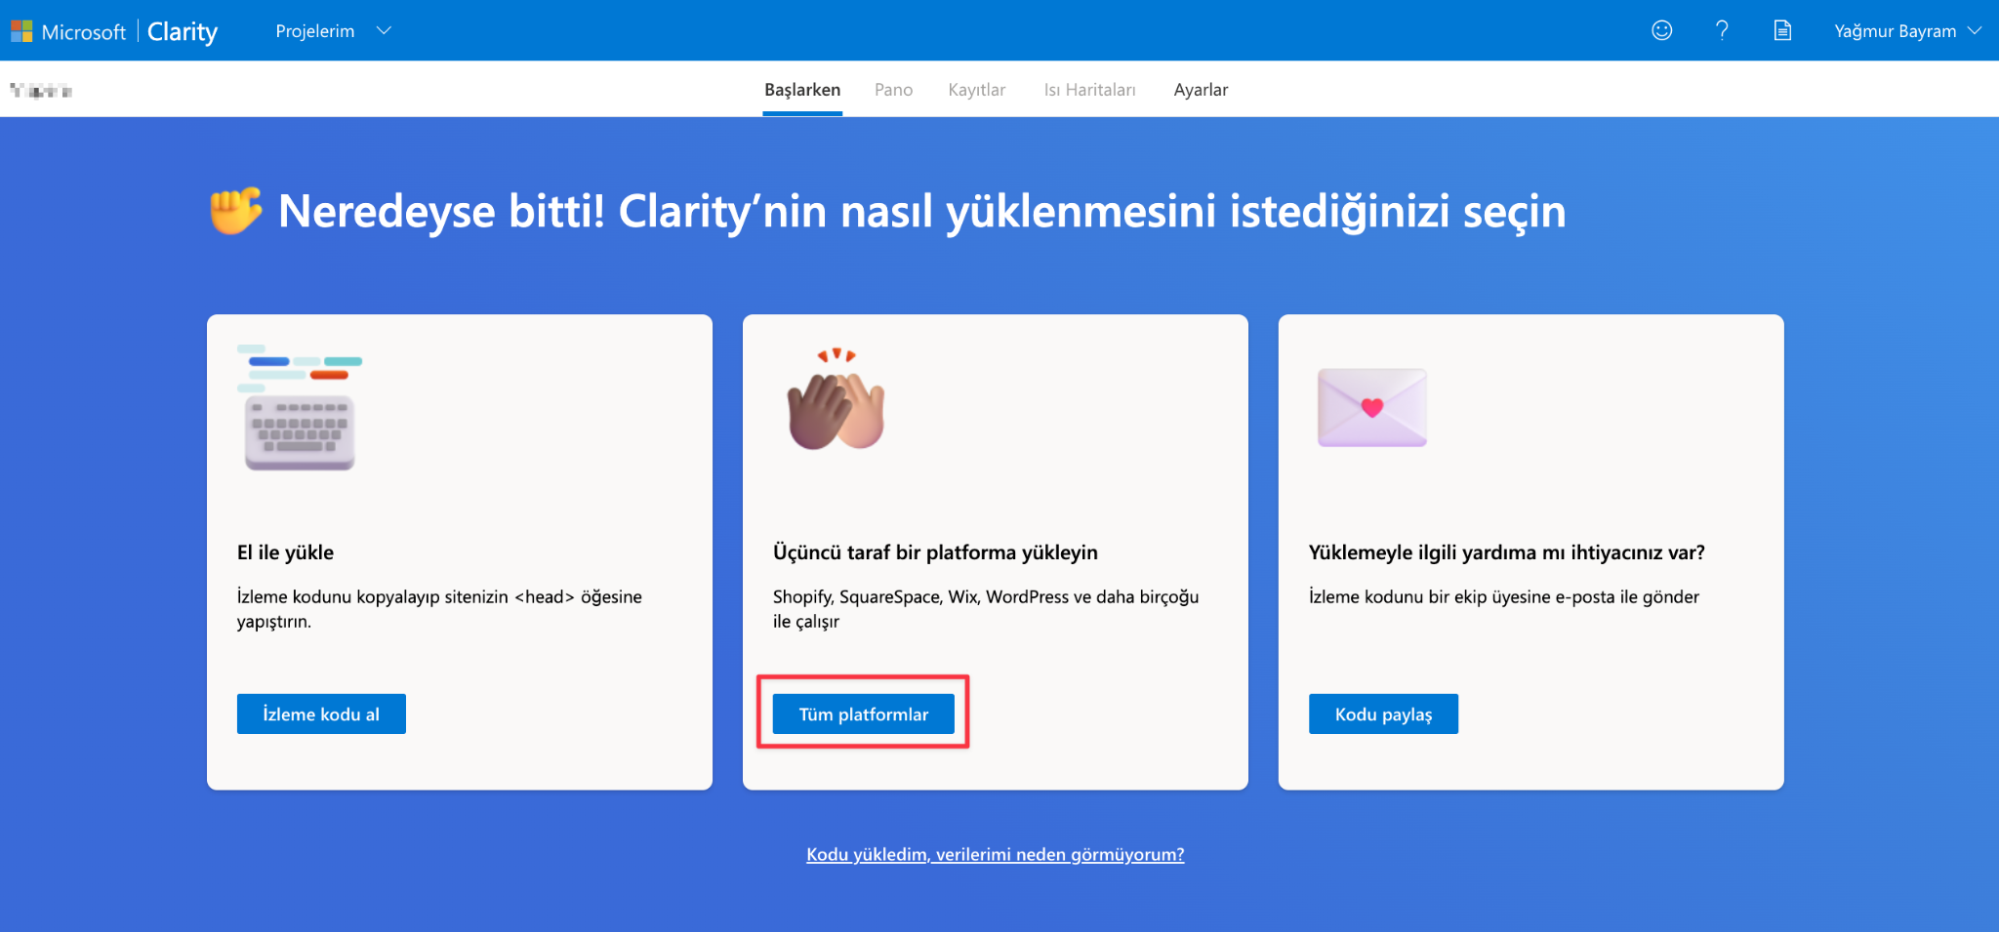
To complete the installation, we select how we want our respective tool to be installed. If you want to install with a third-party platform, view All Platforms for a list of supported platforms and select the appropriate platform for you.
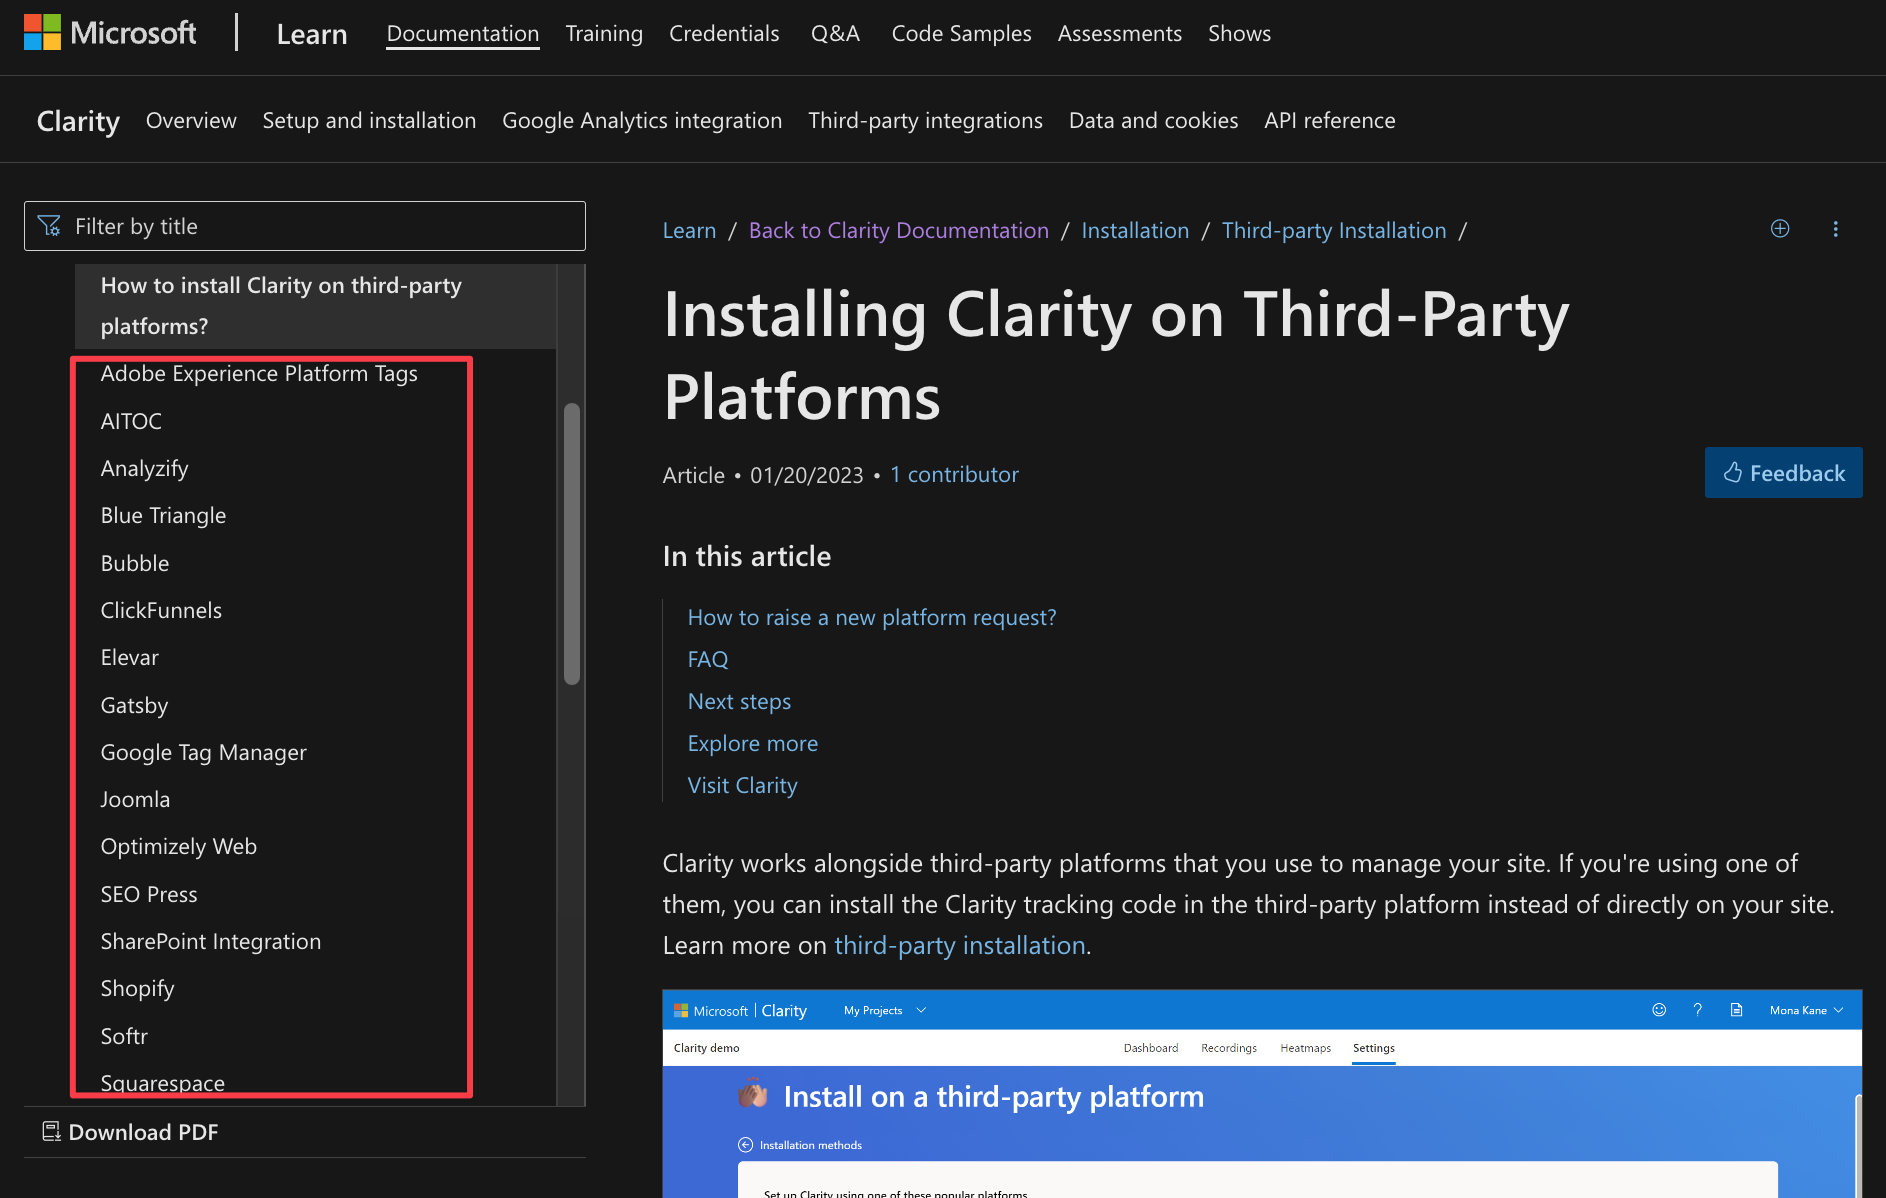
To learn more about how to set up the respective platforms, you can check the list of supported third-party platforms, and as you can see in the image below, you can find details about the platform in the left-hand column.
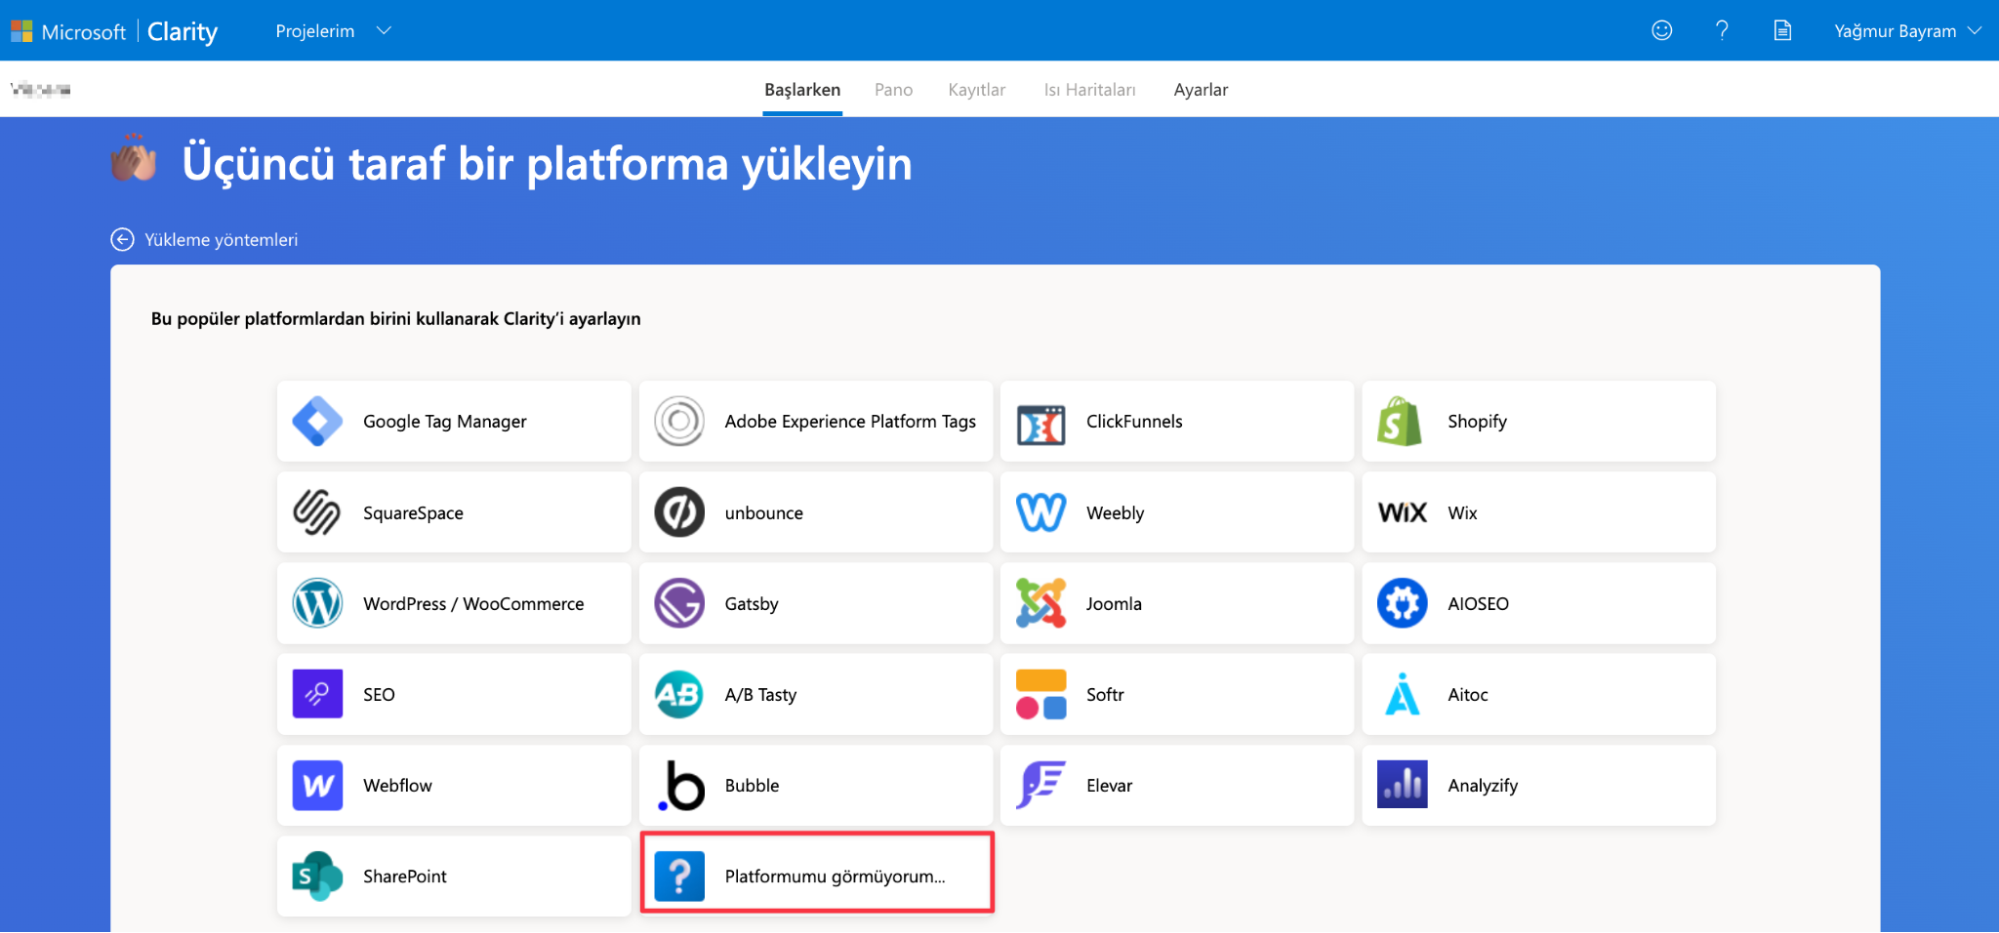
Bonus: If your platform is not listed, select I don't see my platform to send a request.
Click here for the installation guide of Microsoft Clarity, which explains all the installation options with detailed screenshots.
Microsoft Clarity Dashboard
It offers aggregated metrics to get an overview of traffic on your website in real time. These metrics help you evaluate the overall performance of your website. In this way, it has a similar interface to other analytics tools, but with the difference that it offers a lot of metrics.
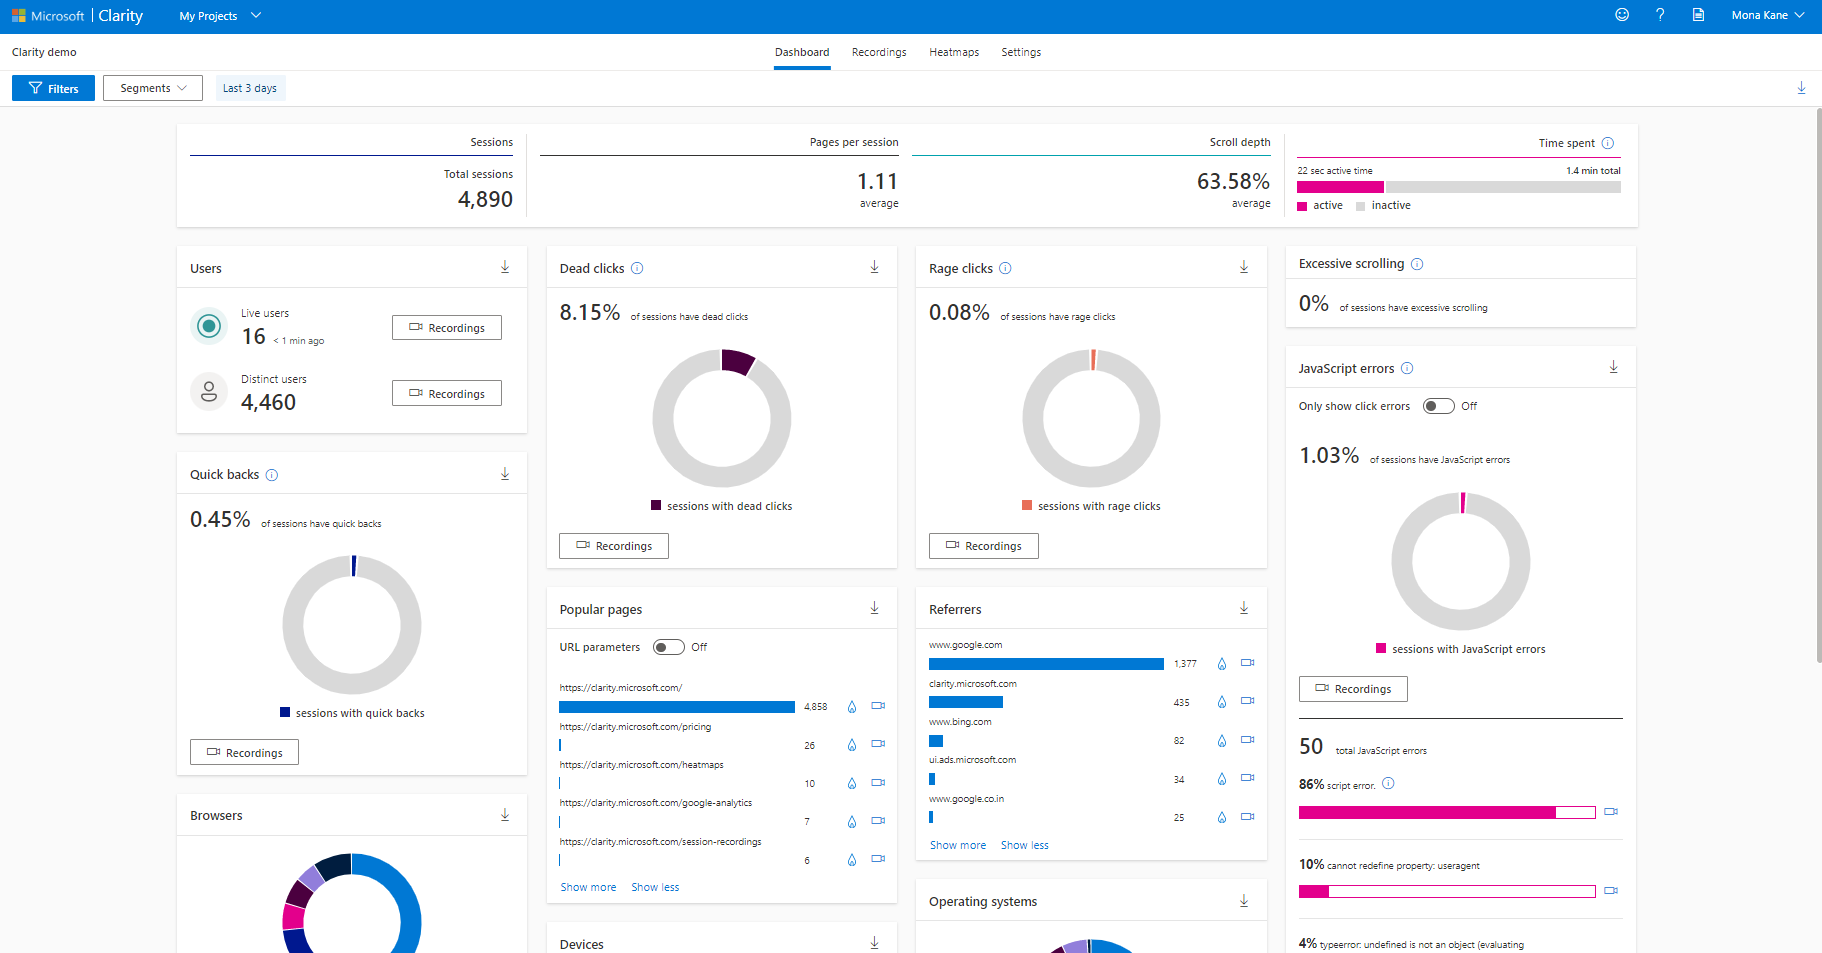
Metrics that can be viewed at first glance:
- Users click on links that don't exist.
- Users scroll up and down the page looking for something they can't easily find.
- Concurrent JavaScript errors occur on your clients.
- The amount of time a user spends browsing your site.
The statistics provided can be sliced and diced using filters and segments that allow you to drill down into specific patterns of user behavior.
Microsoft Clarity Features
The main features of Microsoft Clarity are:
- Heatmaps
- Session Records
- Clarity Insights
Clarity Heatmaps
Clarity Heatmaps provide three types of heatmap data:
Click-Based Heatmaps
The level of engagement of different parts of a website gives us information on where users are clicking, and even where they are trying to click if there are elements that are not clickable.
This data can be further refined and segmented with filters to drill down further and see how different users click on web page elements.
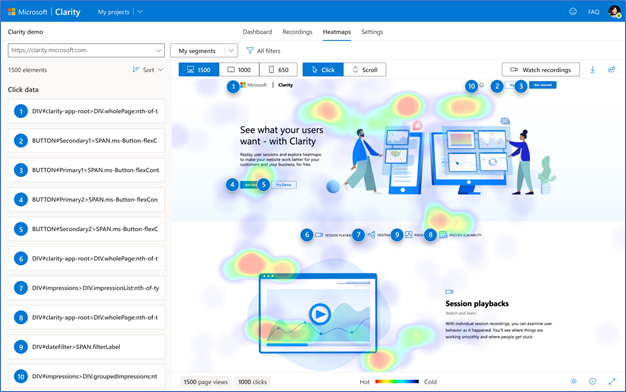
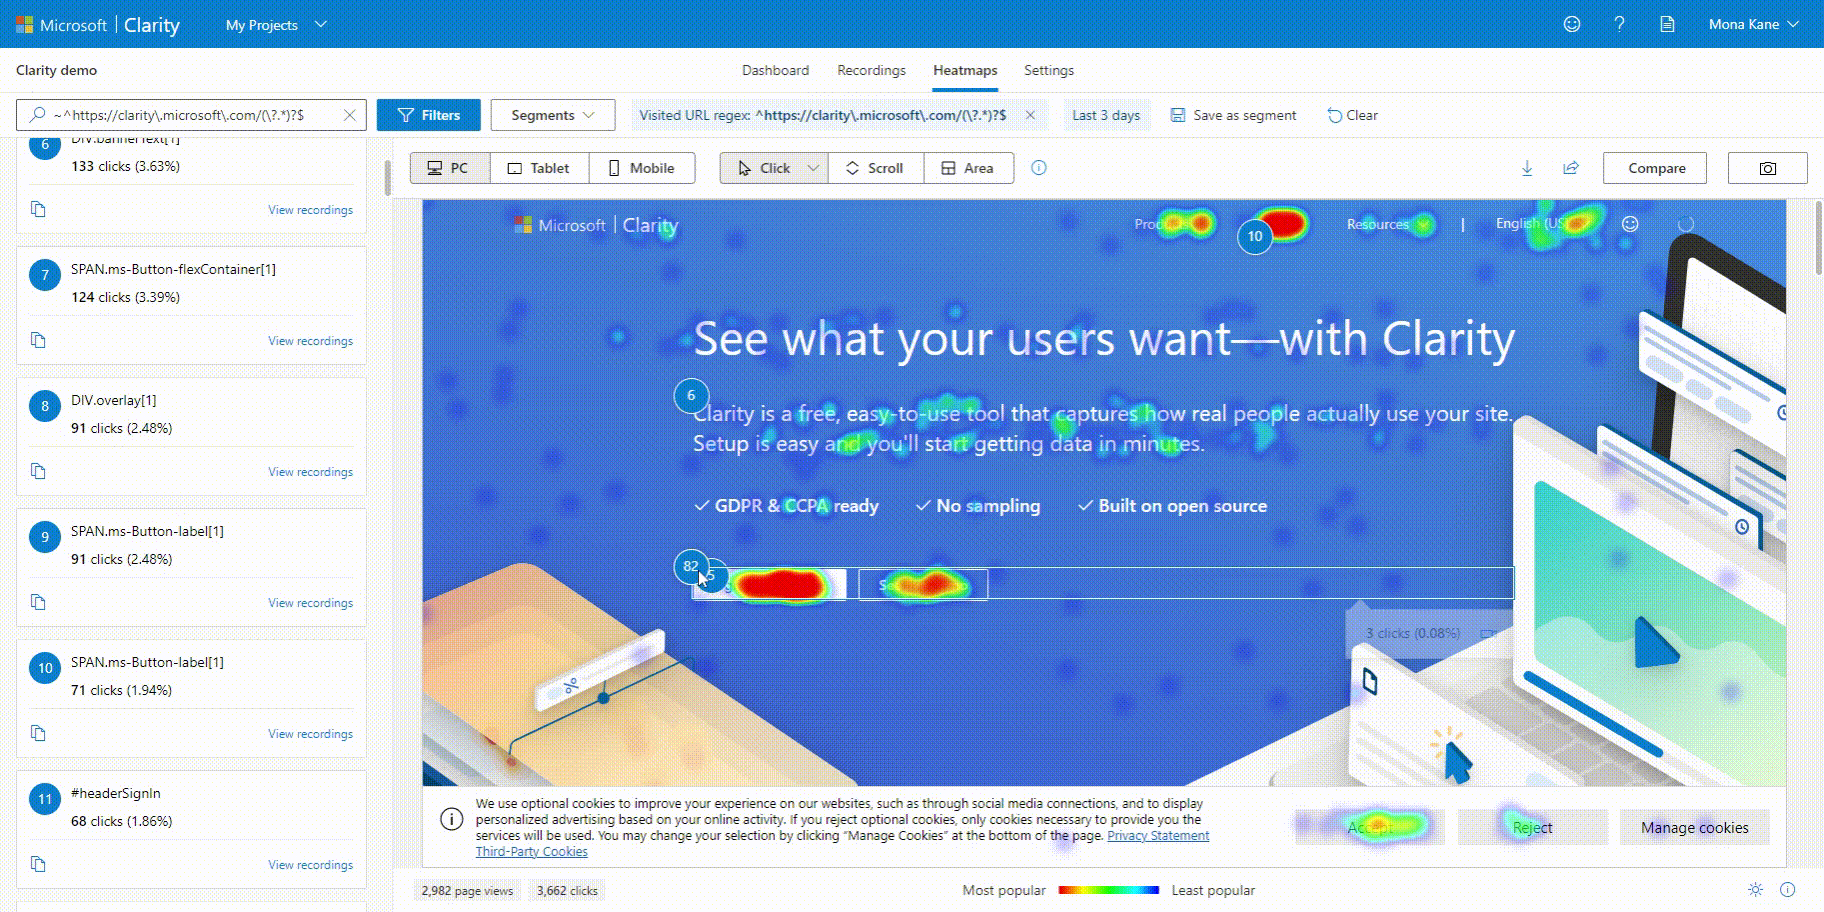
Different types of Click maps are available:
All clicks: Shows all types of user clicks on a page, including dead clicks, rage clicks, first clicks, and last clicks.
Dead clicks: Shows where users clicked on a page with no impact/response. A dead click also occurs when an interactive element does not respond within a reasonable amount of time.
Rage clicks: Indicates where users click in quick succession in the same small area within a short period.
Error clicks: Indicates clicks that occur immediately before JavaScript errors.
First clicks: Indicates the first user clicks on a page. These clicks are useful for learning the user's session pattern on the website.
Last clicks: Shows the last user clicks on a page. These clicks are useful for tracking the user's flow through the website and finding out where on the page you lost the user.
You can take a look at Clarity's click map for a detailed analysis.
Scroll-Based Heat Maps
Scroll Heatmaps show how far users scroll on a web page. Scroll Heatmap data is incredibly useful because it can show how far users scroll before clicking on a call to action and at what minute they stop scrolling. It can also help determine if the call to action reached a button or important information.
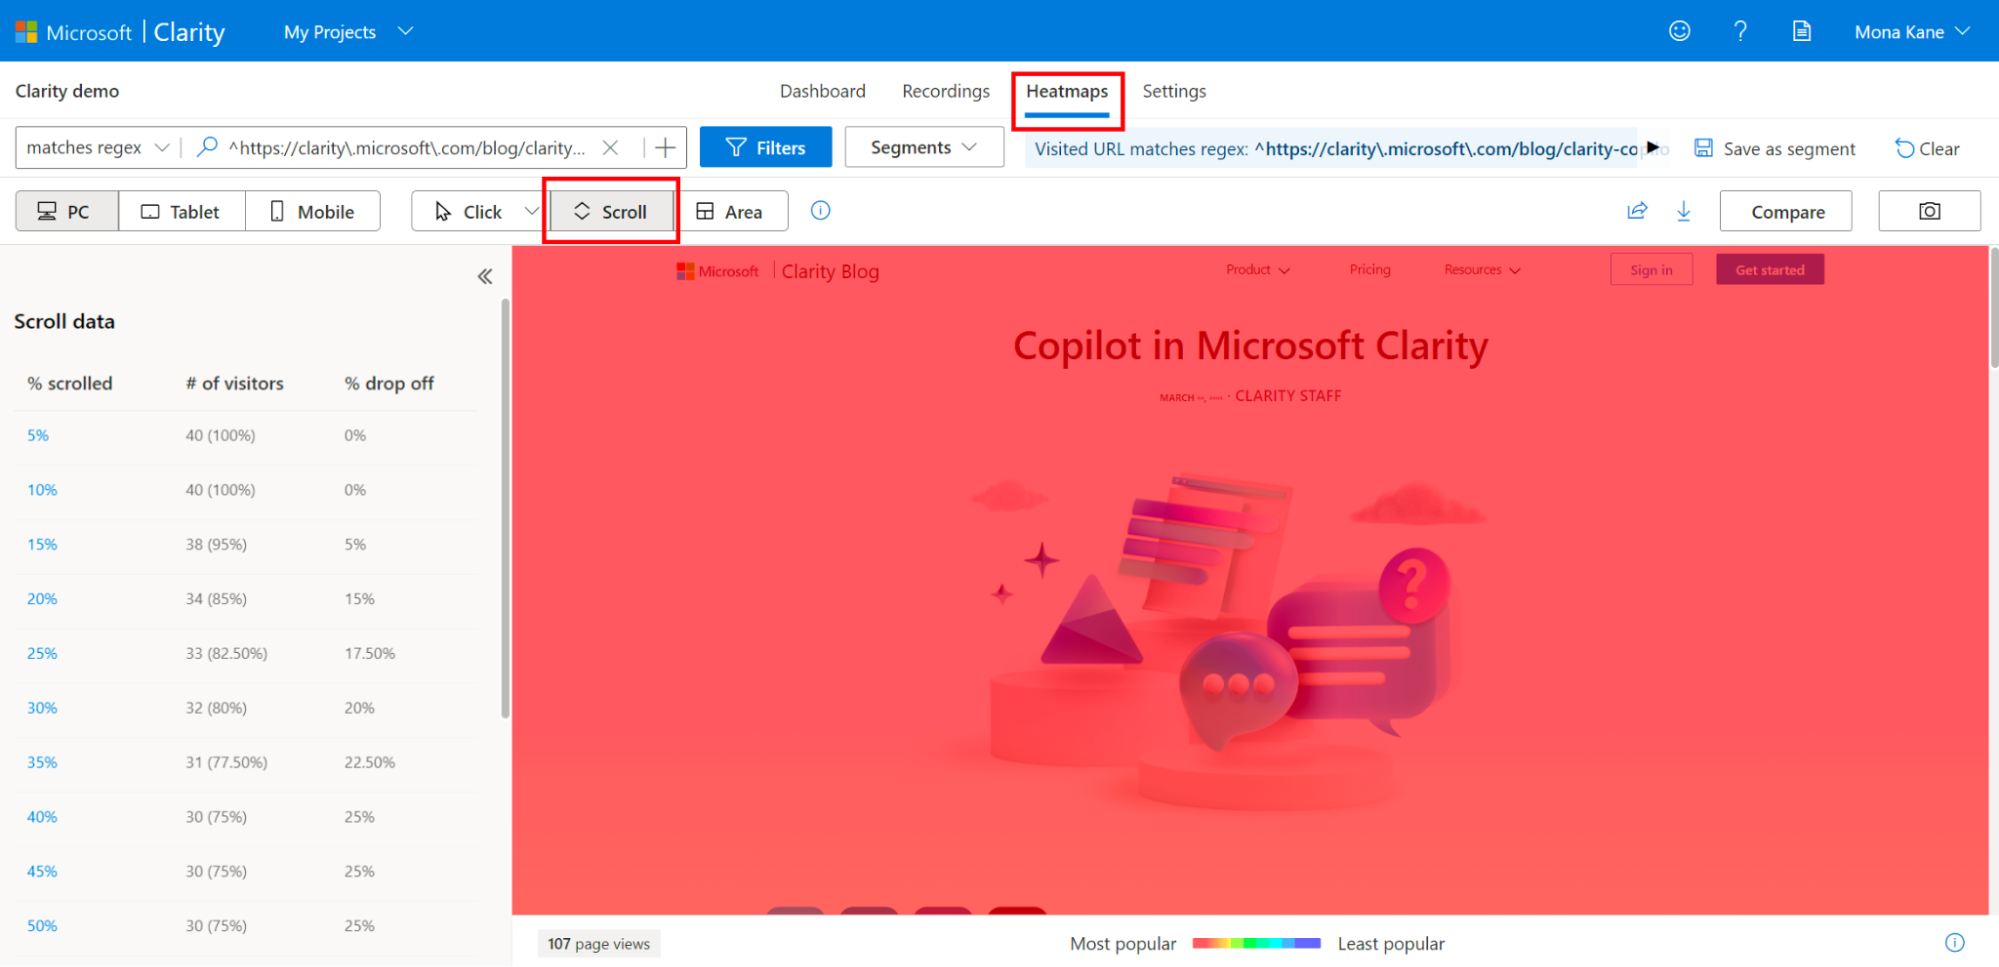
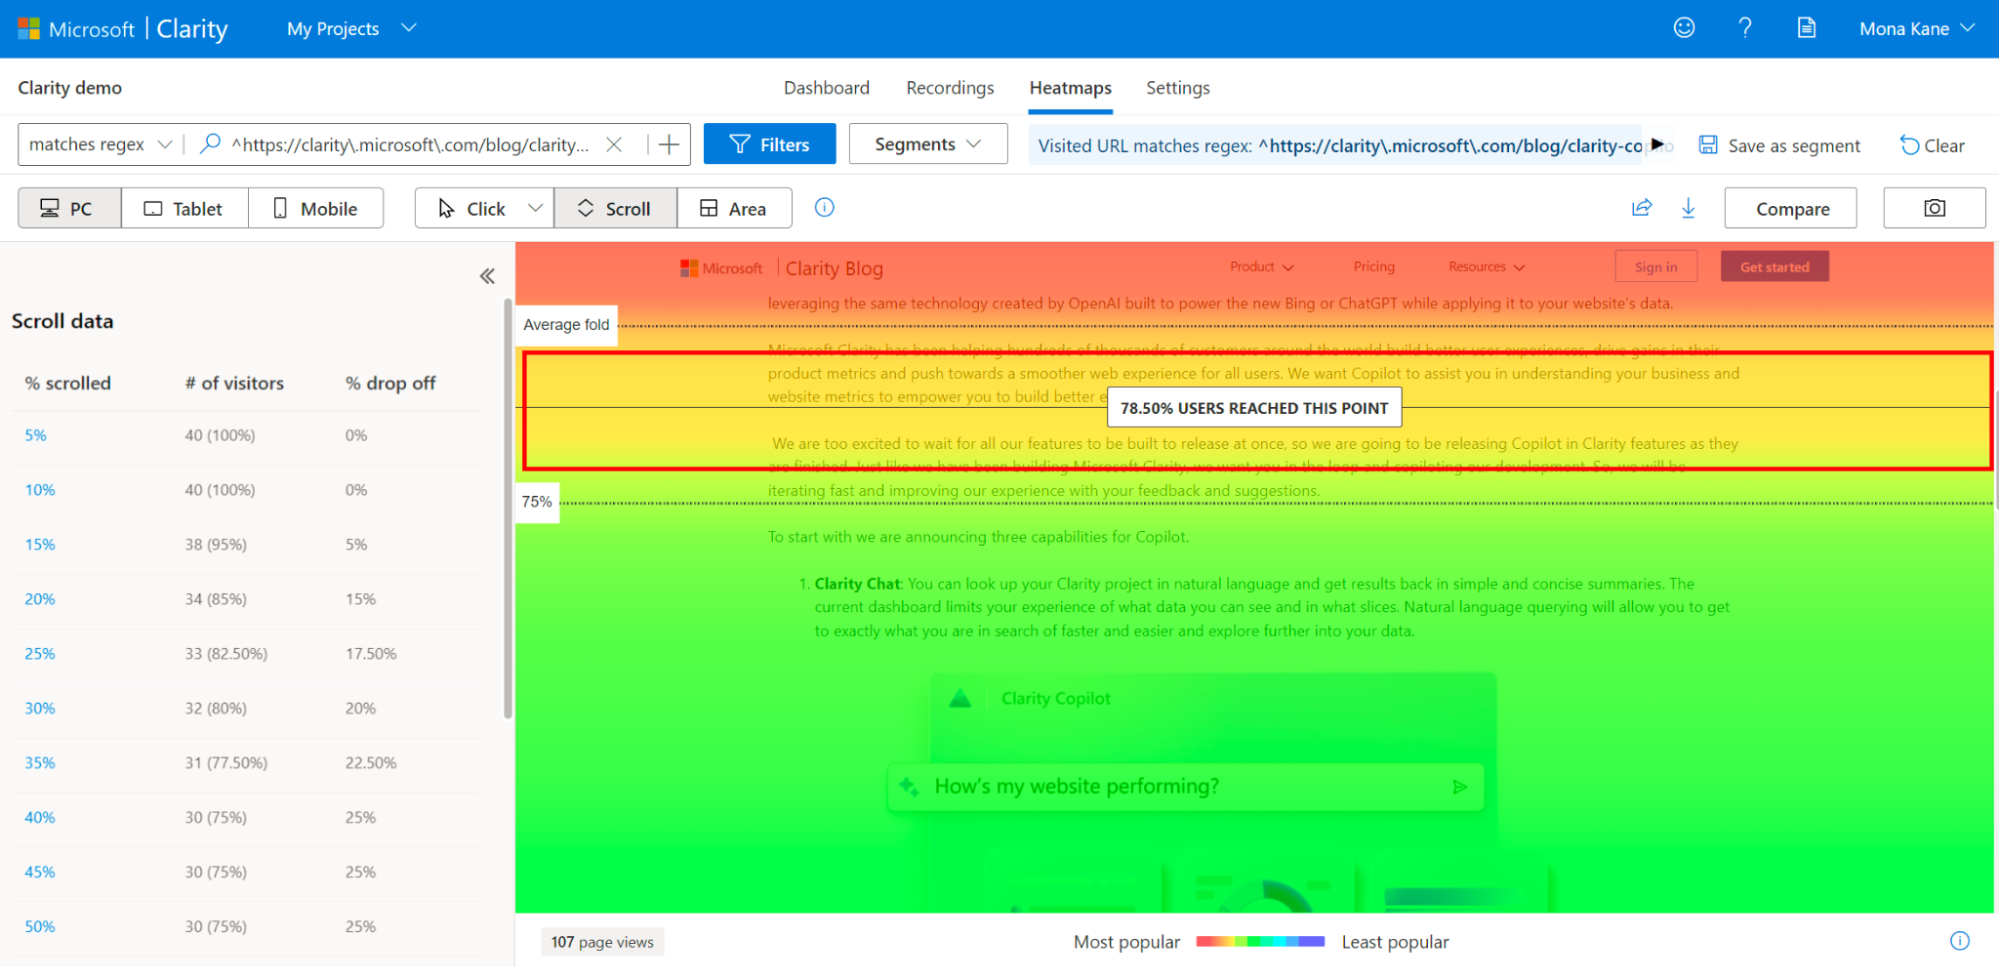
If users are not reaching specific content and are leaving the site without converting, scroll heatmap data shows at what point users abandon your site.
Heatmap data is useful for debugging web page issues by identifying where users click, better understanding the user experience, and identifying where users linger.
For a detailed look at Clarity's scroll map, take a look here.
Area-Based Heat Maps
In an area-based heatmap, you can view the total number of clicks for all items in a selected area. Unlike the click-based heatmap, you can select an area and view the total clicks for all items in the area. You can also access area maps for a single page or group of pages.
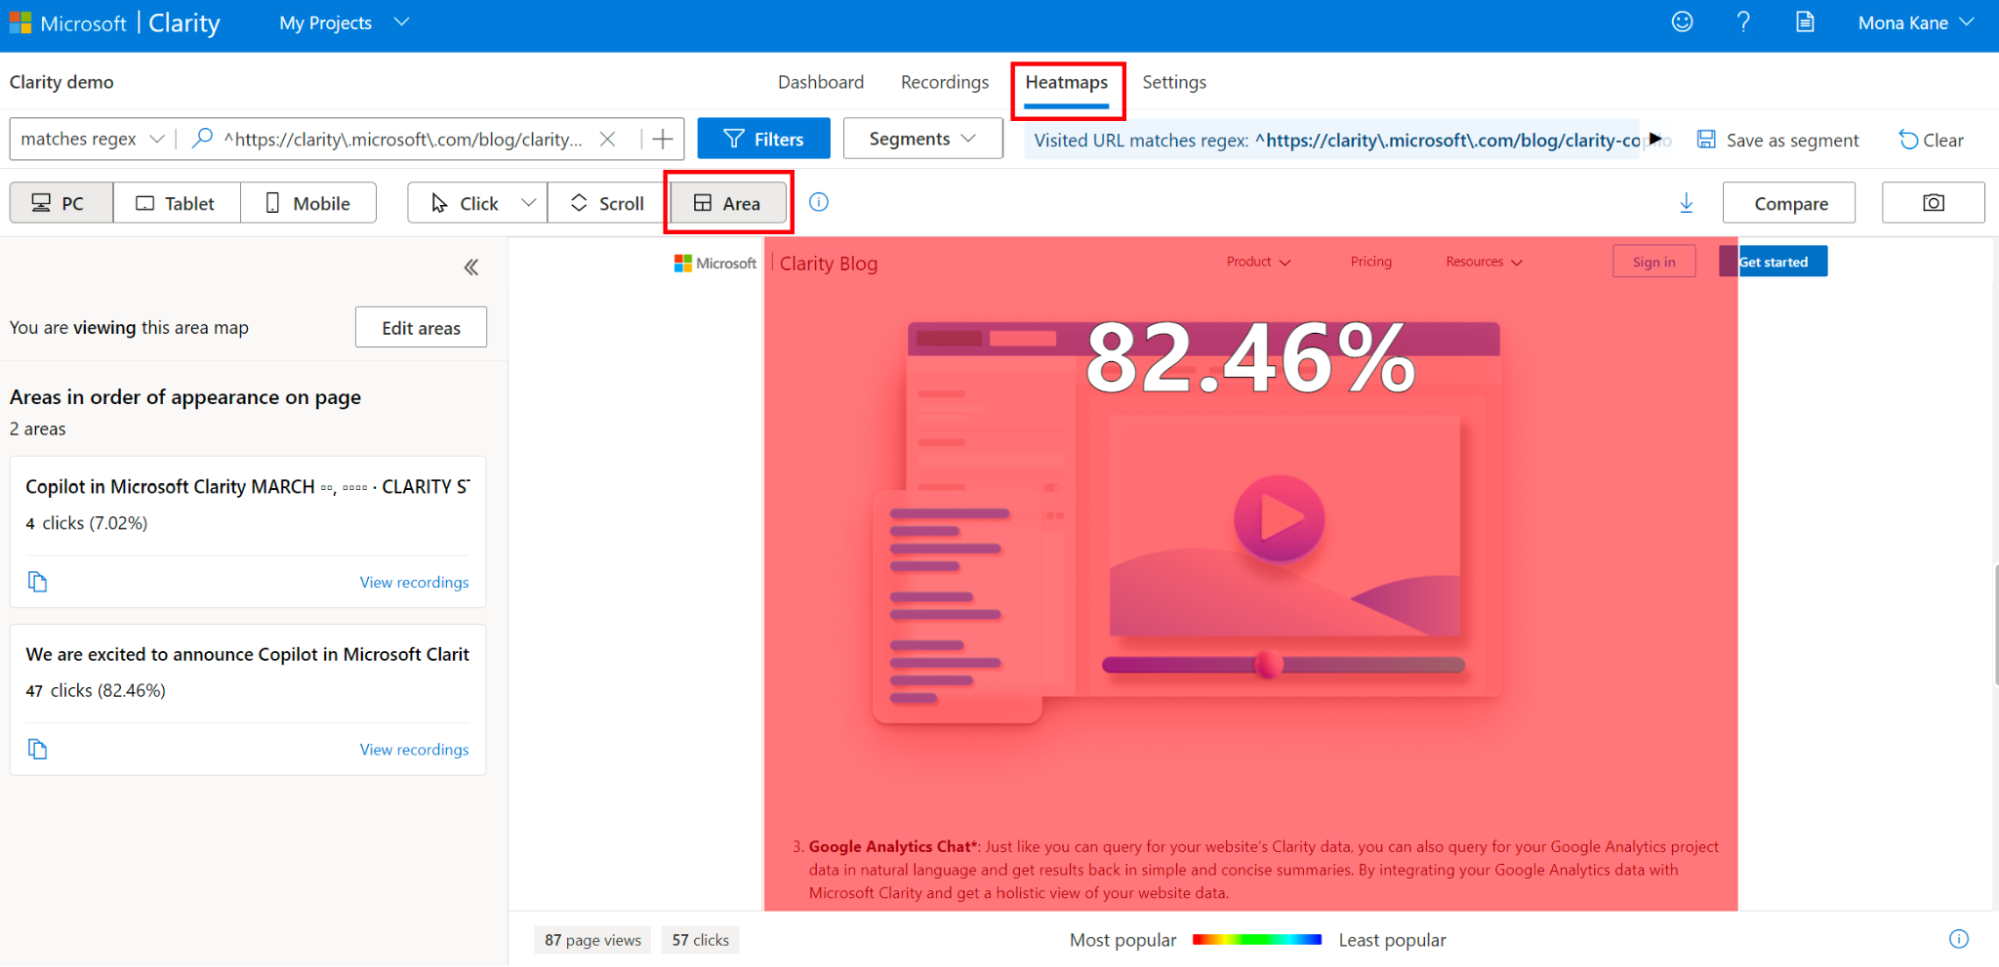
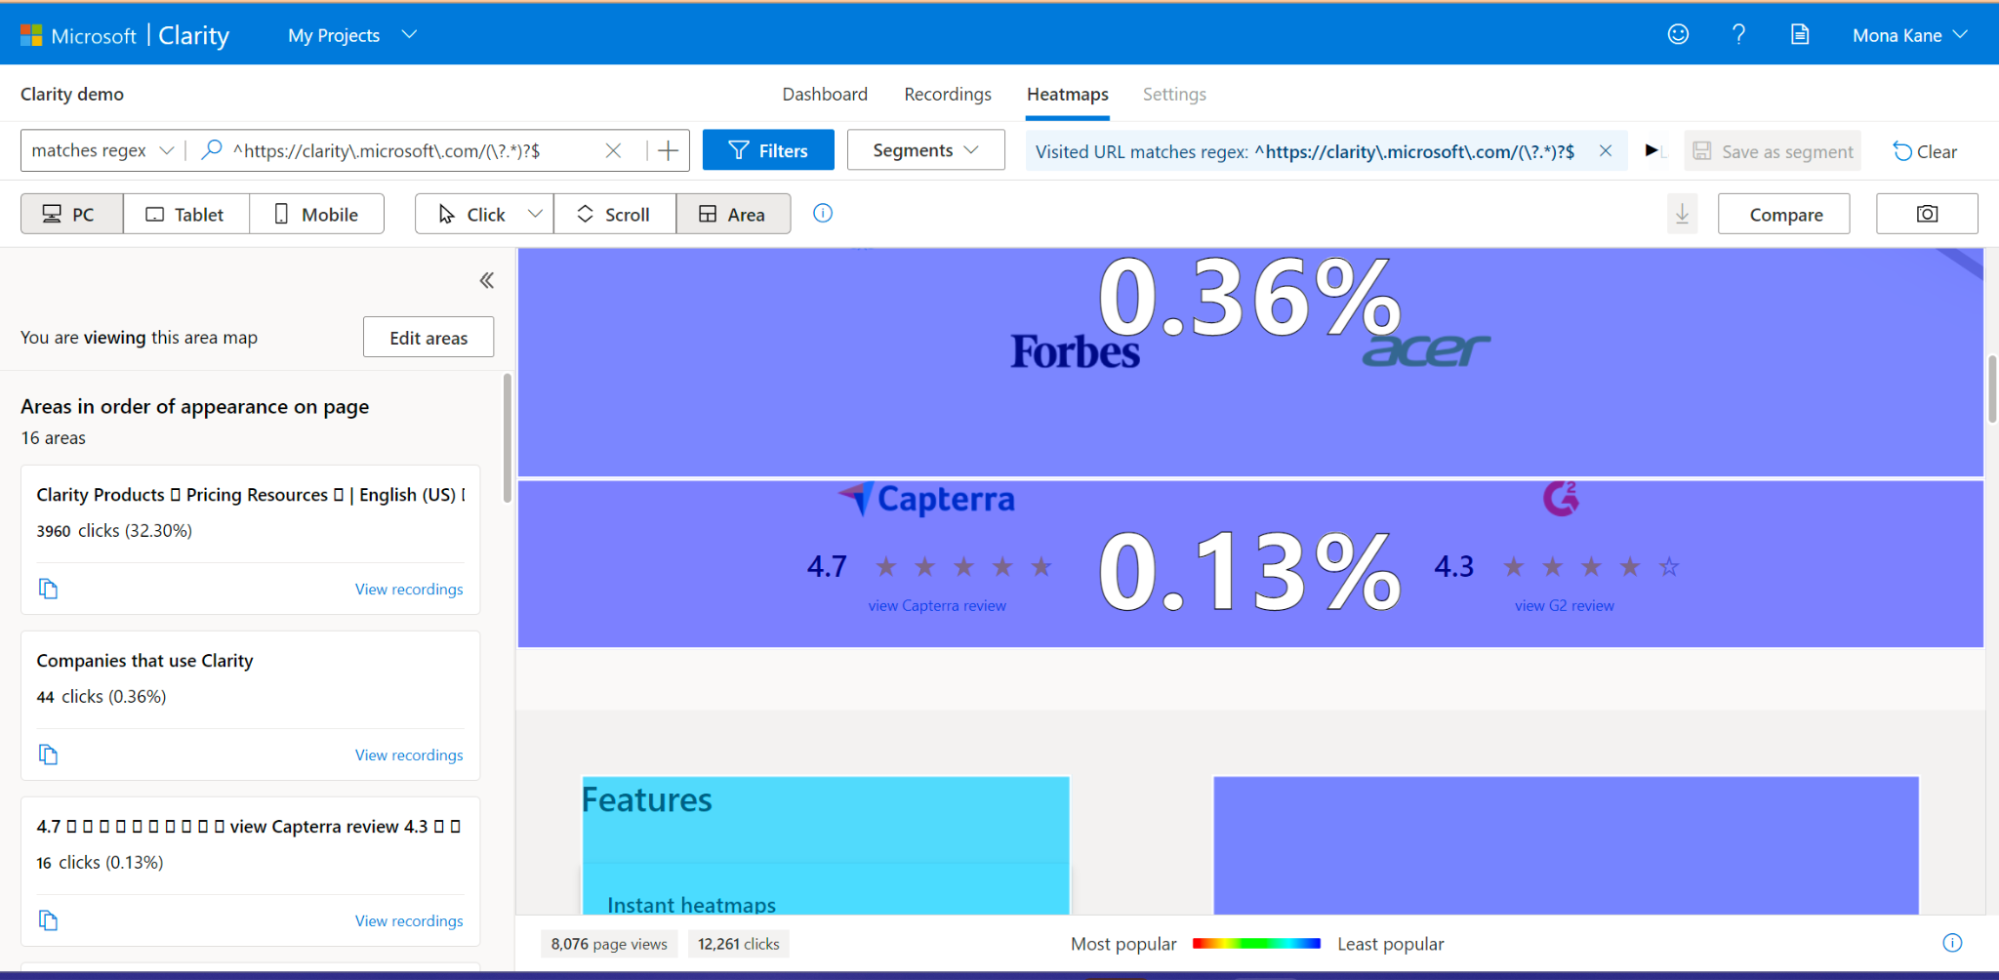
You can take a look at Clarity's area map for a detailed review.
The most important aspect of Clarity Heatmaps is that it helps improve conversions. Most sites have a conversion or engagement process that users are asked to complete, whether it's clicking on an ad, buying a product, clicking an affiliate link, or signing up for a membership.
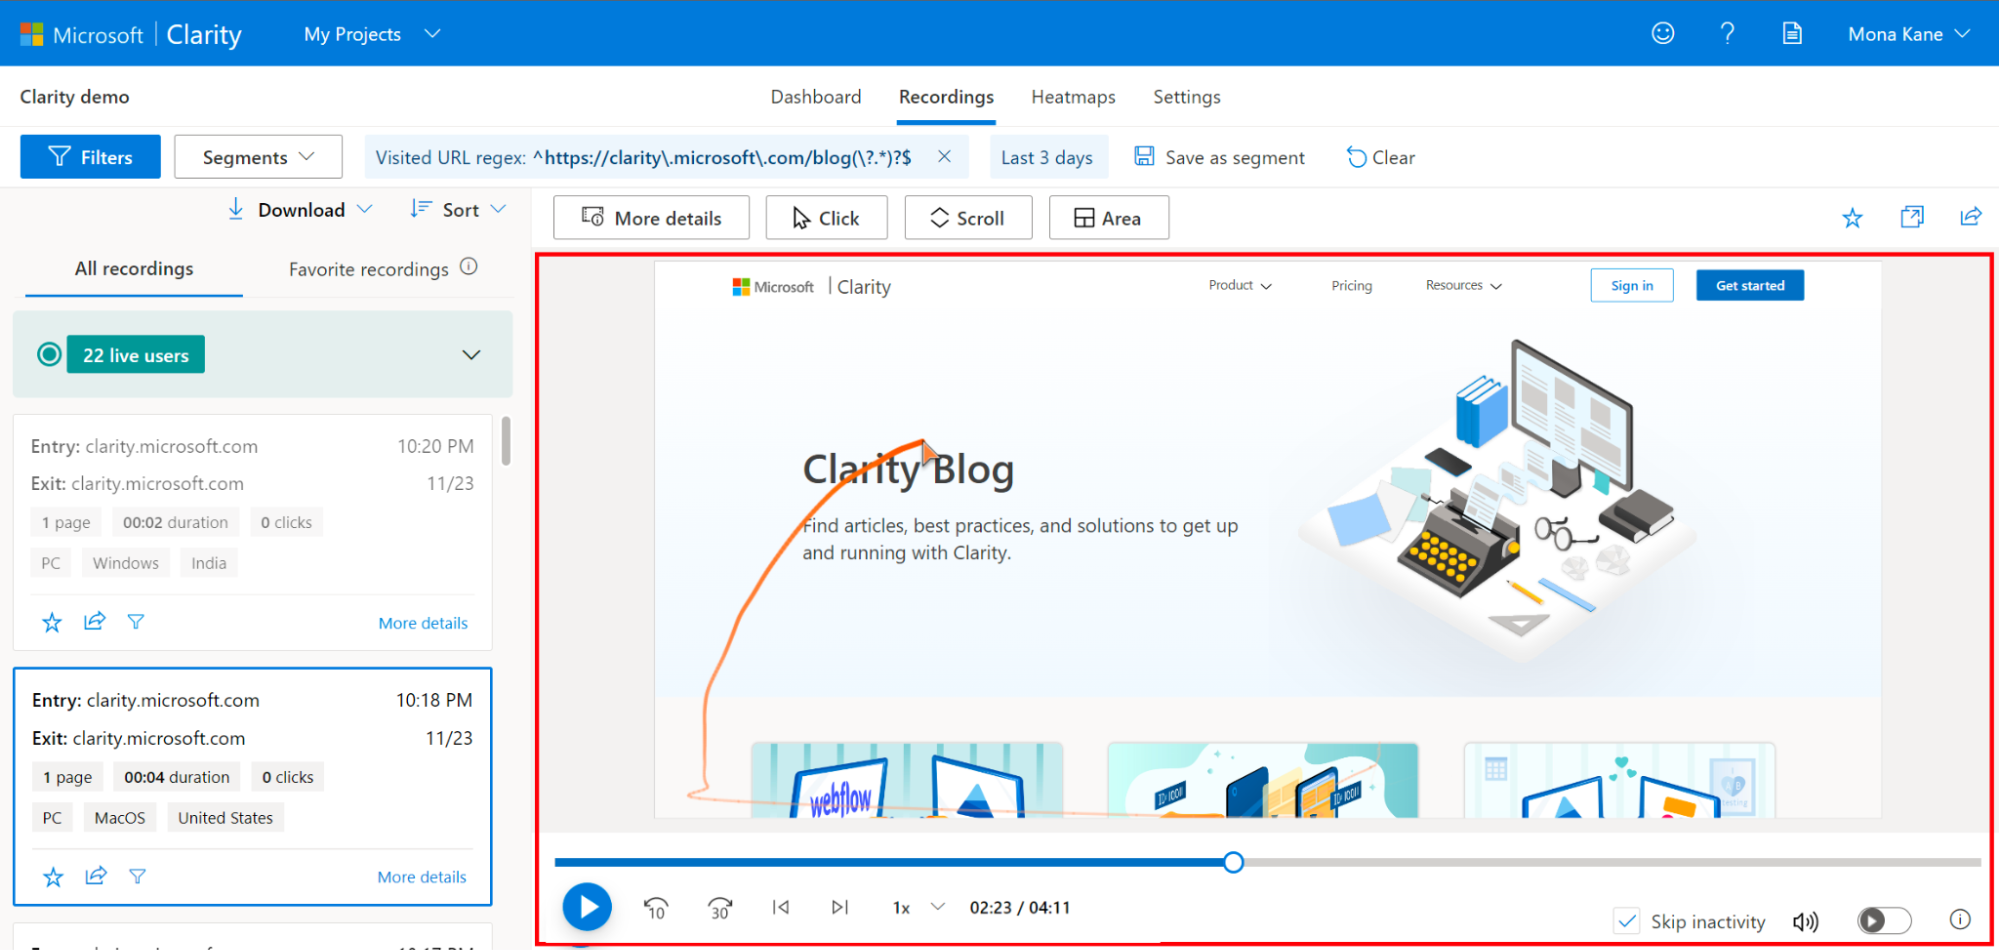
Session Recording
Session logs are a visual way of observing user interactions on your site. This allows you to track the full extent of a user's website experience journey and understand where your visitors prefer, or where they don't prefer, and where improvements may be needed. Session logs capture user activity, such as what a user scrolls, watches, clicks, or skips, and retain it for 90 days. After reviewing and evaluating your session logs, you can implement adjustments to improve your page performance and increase conversion rates.
Session logs help answer important questions such as, but not limited to, the following.
- What is the visitor trying to do on your website?
- What do your visitors see as the main content?
- Did your visitor miss important information such as a CTA (call to action) because they didn't scroll far enough?
- Where are the points where the user is frustrated or angry?
- What is breaking on your site?
- What can be improved on the site?
Why Use Session Logs?
You can review recordings to evaluate the performance of your website and improve the quality of the user experience. The prominent reasons for using session recordings in Clarity are as follows:
User motivation: Develop insights into how users experience the website by analyzing their scrolling pattern.
User pain points: Track a variety of user experiences using recordings to get a deeper understanding of your page optimization. Example: A pop-up, a module, or a button may not display properly on mobile devices, leading to user frustration with the website.
Determine the content layout: Evaluate logs to verify that visitors are moving through your website as expected. Example: If users don't click on your CTA, skip past your CTA without noticing it, or perceive various parts of the page as CTAs, this can indicate user confusion and means you need to optimize for it.
Session logs can also detect angry clicks, dead clicks, quick bounces, and excessive scrolling.
Conclusion
Microsoft Clarity offers developers and marketers a unique perspective on website analytics and user behavior analysis. This data is extremely valuable for enhancing user experience, improving conversion rates, and identifying and resolving errors and issues. You also have the opportunity to use all this analytical data to make your website more user-friendly and efficient and to improve the overall performance of your site.


