


Free Google Analytics 4 Looker Studio Template for Everyone
Using our expertise in web analytics, we have created a customizable Looker Studio template that allows anyone to work with their own Google Analytics 4 data. With this template, you can use your GA4 data to create an interactive and visually rich report for yourself.
We are sharing this template with you completely free of charge! Now anyone using GA4 and Looker Studio can easily analyze their data with this flexible template. When you copy the template and add your own GA4 data sources, the reports will instantly take shape according to your data. Thus, you will be able to get perfect reports with interactive graphs and tables tailored to your needs.
In this article, we will explain the advantages and usage of our template in detail. Have a pleasant reading!
Report link:
https://lookerstudio.google.com/reporting/bb555153-0716-4b30-99db-89e68f2ba6b7
Customize the Report with Your Own Data
Using this template, you can fully customize your reports based on your own Google Analytics 4 data sources. After copying the template, you can adjust all the charts and tables within it to use your GA4 data sources. The result is an interactive report that is completely customized to your data. You can filter according to the dimensions and criteria you want, and compare different periods. In short, you will be able to analyze your GA4 data most efficiently with your customizations for your needs.
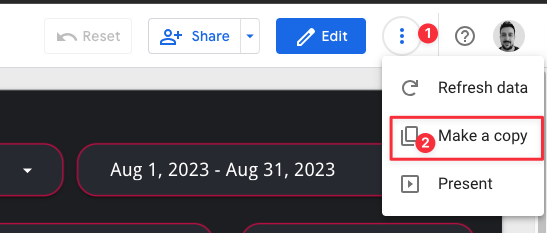
Step 1: Make a Copy
Create a copy of the report by hovering on the top right of the information.
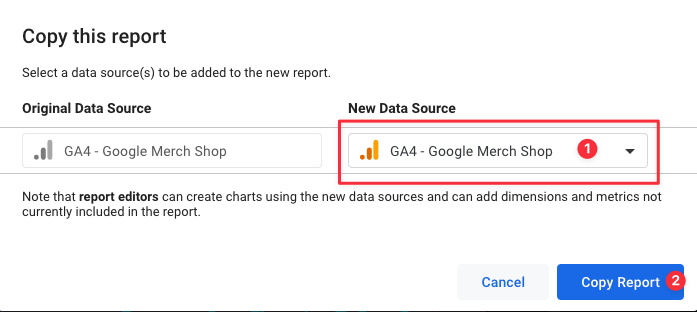
Step 2: Choose Your Property
It will then ask you to select a new data source. You can select your own GA4 property and say "Copy Report". After saying this, the data in the report will be completely customized with your data.
How Should We Read the Data in the Report?
Traffic Overview
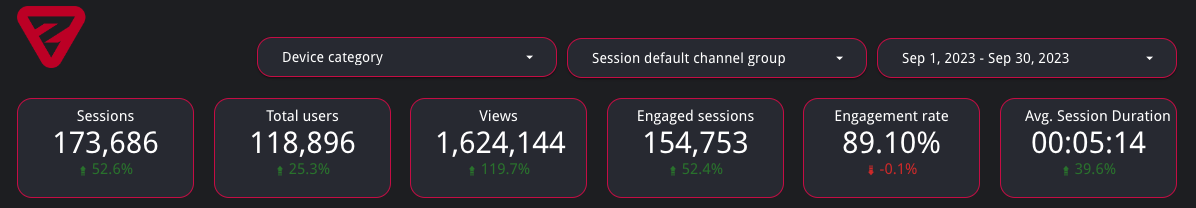
After customizing the report for your data, all fields will appear with your data as shown below.
- There is a date on the far right of the report, when you select the date here, the report will be customized according to the selected period. The percentage expressions under the scorecards indicate the increase or decrease of the selected period compared to the previous period.
- From the Device category field, you can select the device you want and customize the report according to the traffic coming from that device.
- The session default channel group dropdown will organize your report according to the traffic source you have selected.
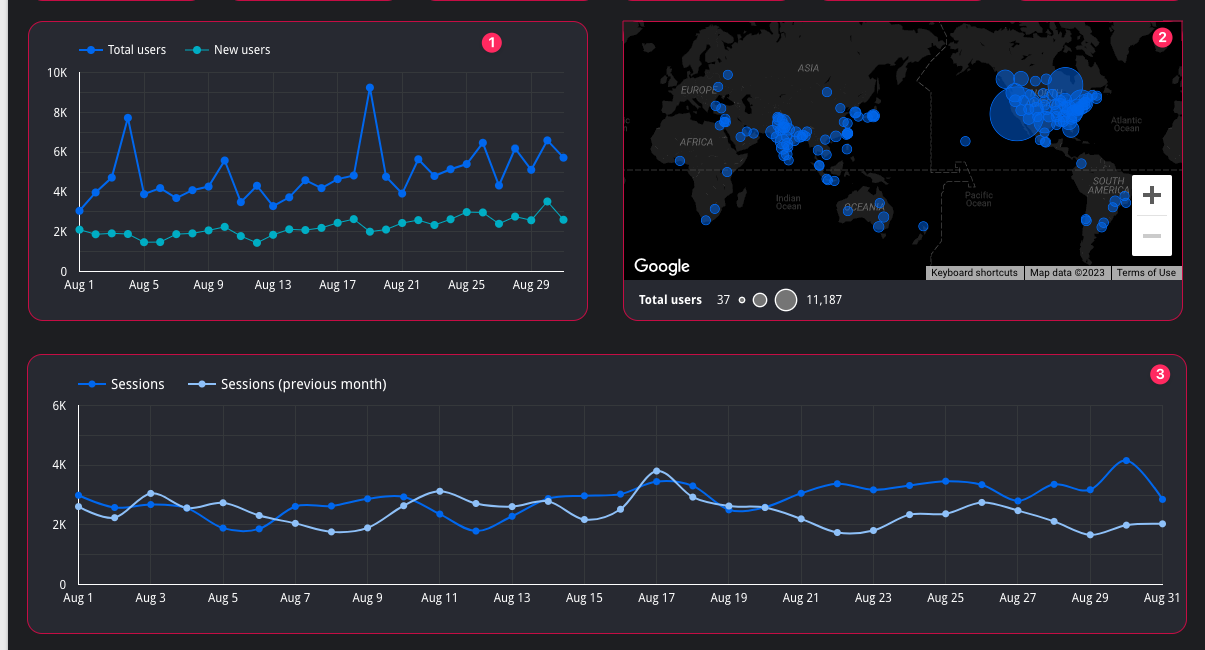
1- In this table, you can see the "Total Users" and "New Users" metrics for the selected month period in the form of days of the relevant month.
2- In this map visualization, you can get an idea from which geographical area your users visit your site.
3- As in the first table, you can also view the "Session" metric as a line graph according to the relevant month and the previous month.
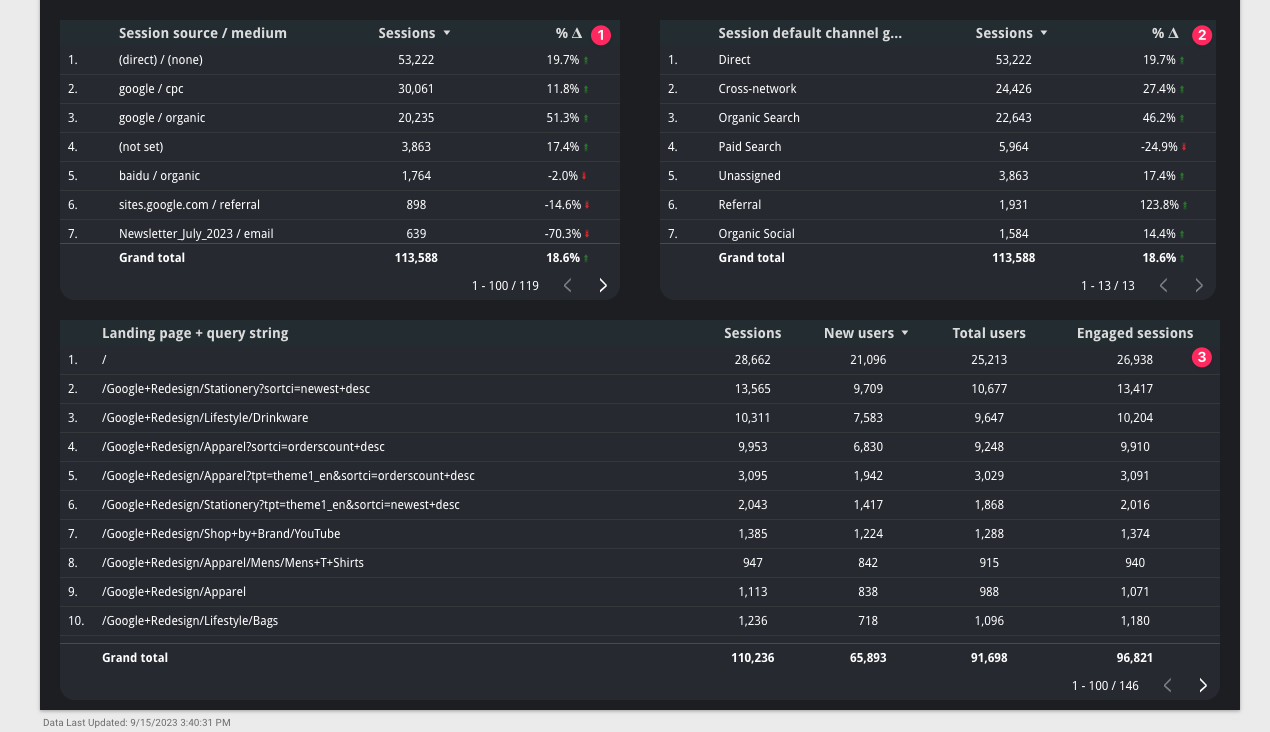
1- In this container, you can see the source/vehicle details of the traffic to your site and you can see the increase or decrease compared to the previous period.
2- In the Session default channel group, you can find your traffic channels and their performance compared to the previous period.
3- This section shows you the "Landing Page" performance of your site. You can measure your landing page performance according to "Sessions, New Users, Total Users, Engaged Sessions" metrics.
Engagement & Users
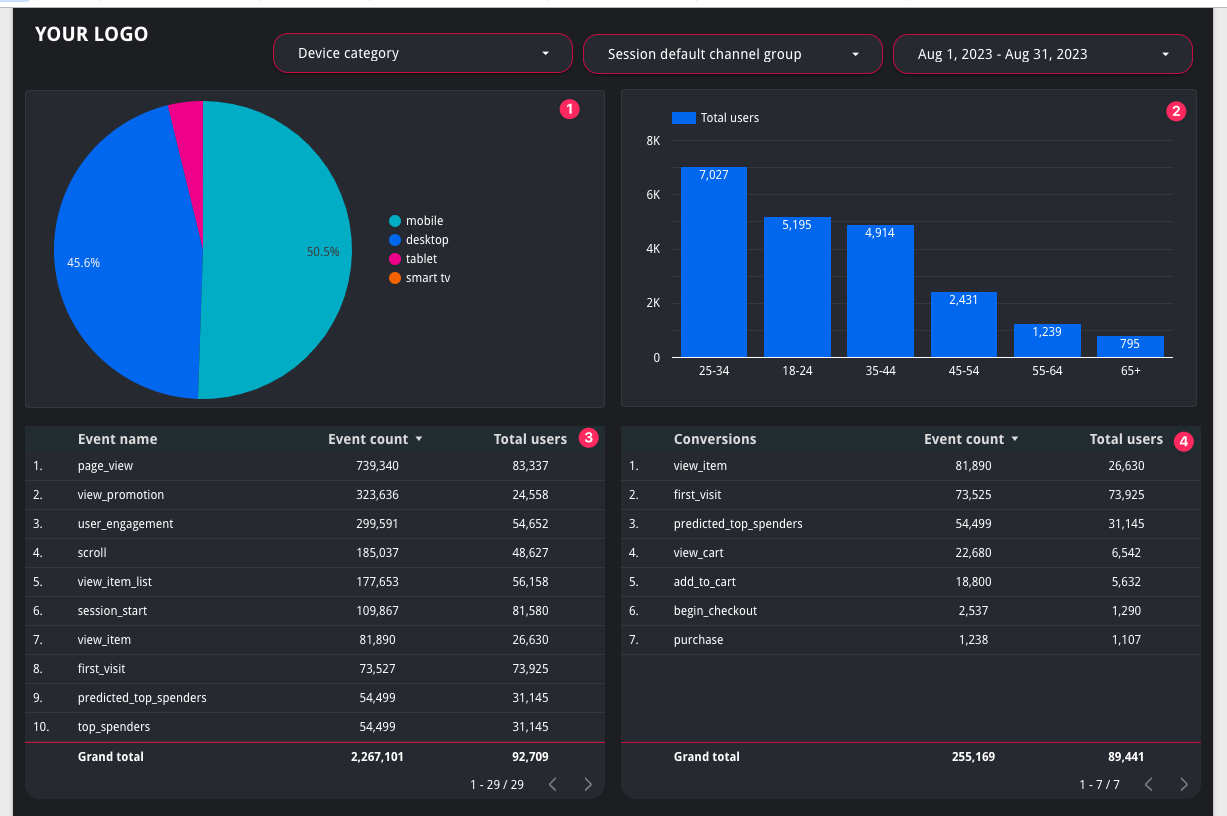
When we go to the "Engagement & Users" page of the report, we are greeted with the fields above. For date and other dropdown selections, the situation we described in the first sentence applies. We have numbered the other sections below.
1- Here we can see our device categories in the form of a pie chart. You can analyze your mobile, desktop, or tablet traffic here.
2- In the area on the right side, you can see the age distribution of users coming to your site. Since user information is restricted for privacy reasons in GA4, this does not give you 100% of your users.
3- We can see how many times all our events are triggered by how many users.
4- In the section at the bottom right, you can find the events you have marked as conversions.
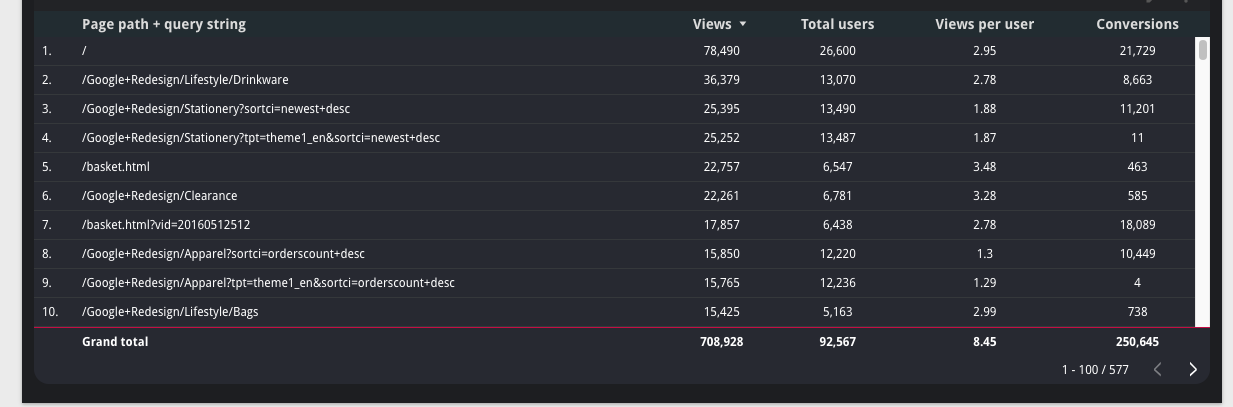
At the bottom of the report, you can see your user performance by page views and pages.
Google Ads
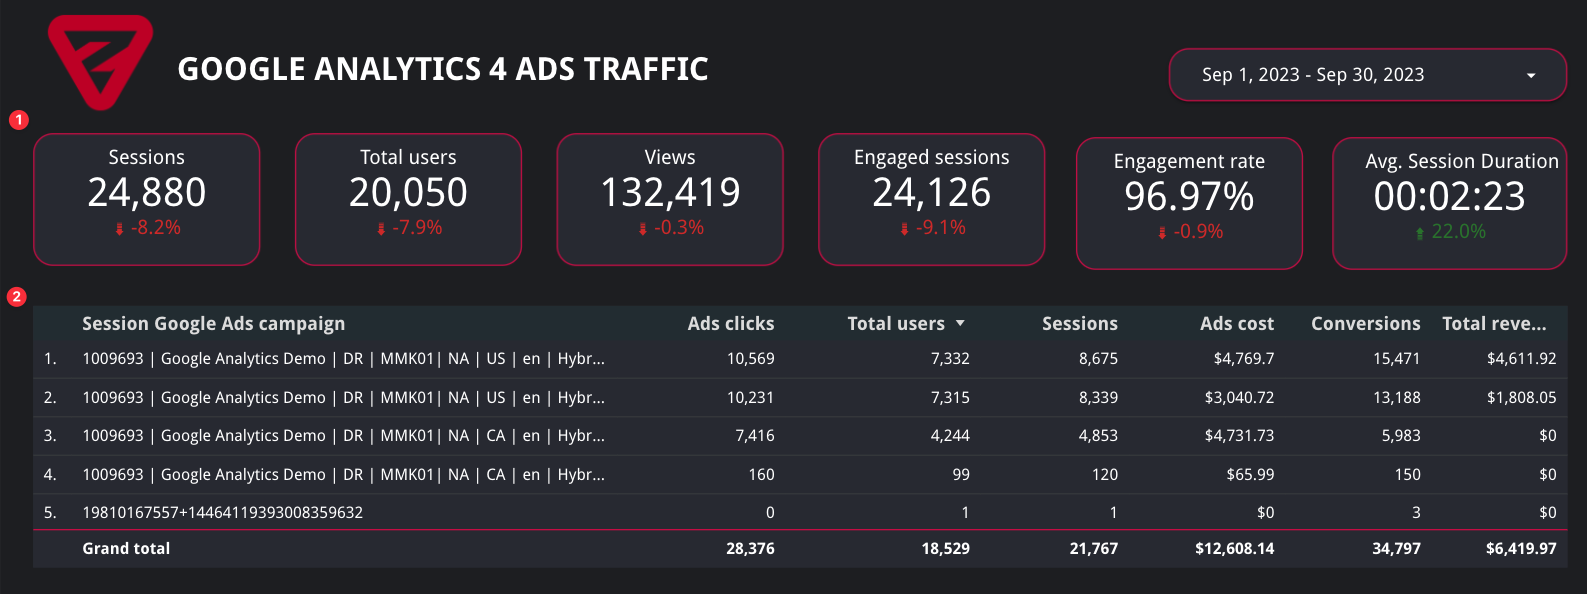
When we go to the Google Ads page, we are greeted with report screens that are completely filtered by ad traffic.
1- The traffic that appears in the scorecards is only the traffic that includes your ad performance.
2- In the table, you can see your Google Ads campaigns and Ads clicks, Total users, Sessions, Ads Cost, Conversions, and Total revenue if available. Note: For data to appear in this field, you must have connected GA4 & Ads tools.
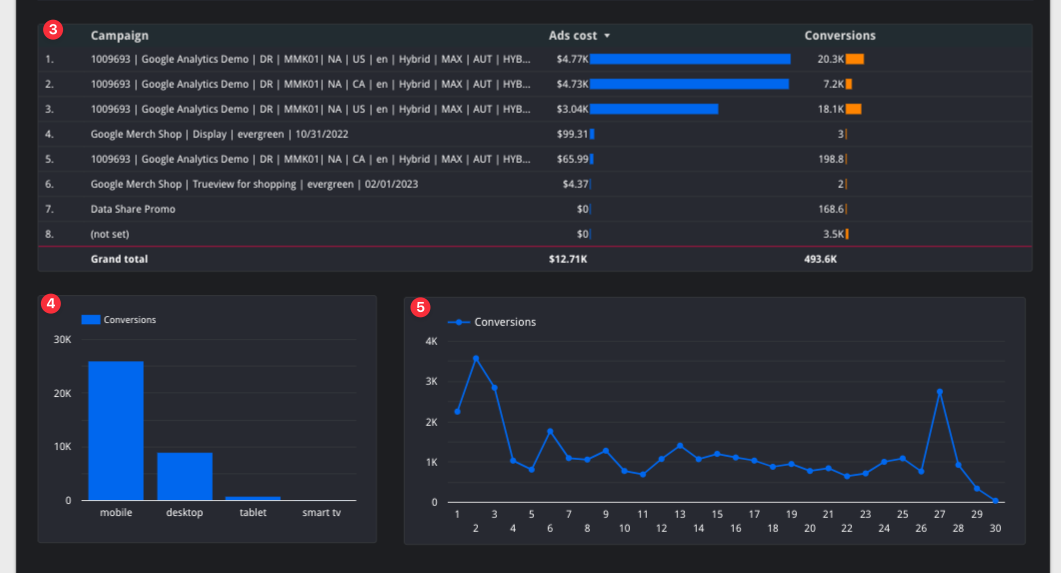
3- In this table you can see the cost and conversion comparison of your campaigns.
4- The bar charts here will give you insights into your conversion performance by device distribution.
5- You can measure your conversion data day by day with the line chart.
SEO
On the SEO page, you can only see containers filtered with "organic" traffic.
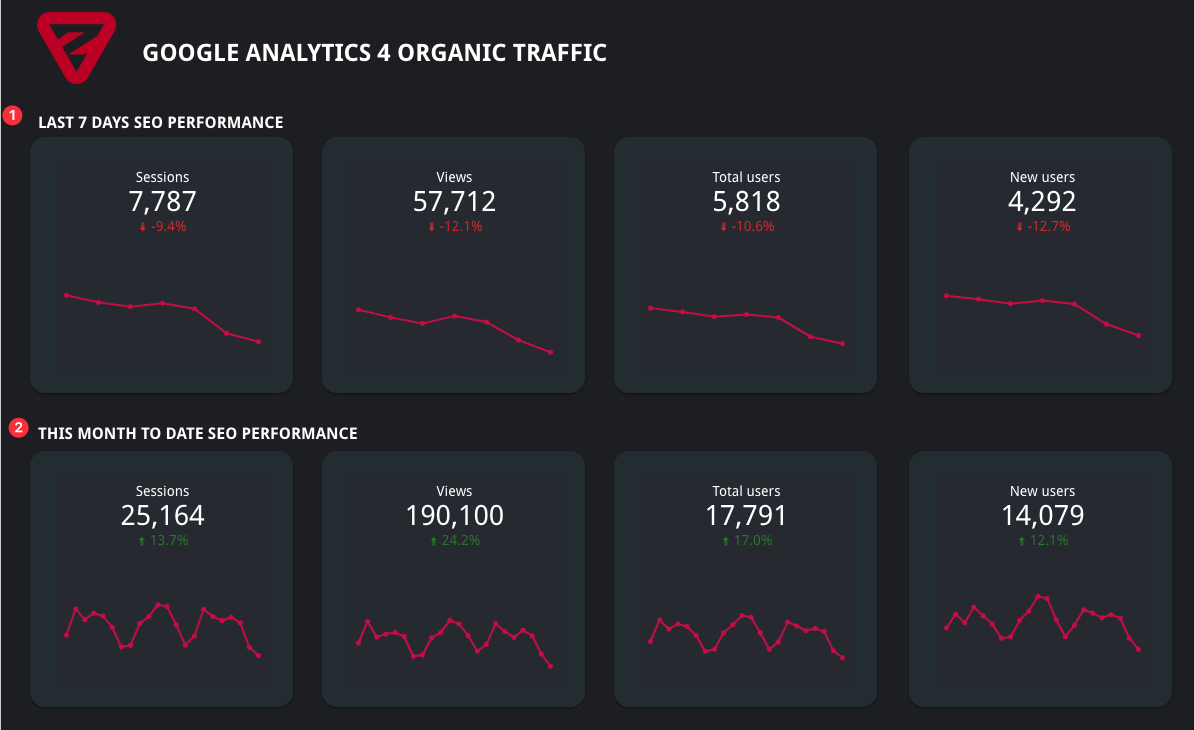
1- You can track your SEO traffic in the last 7 days and the comparison with the previous 7 days in this area.
2- The graphs for the current month and the same period before that will welcome you in this area.
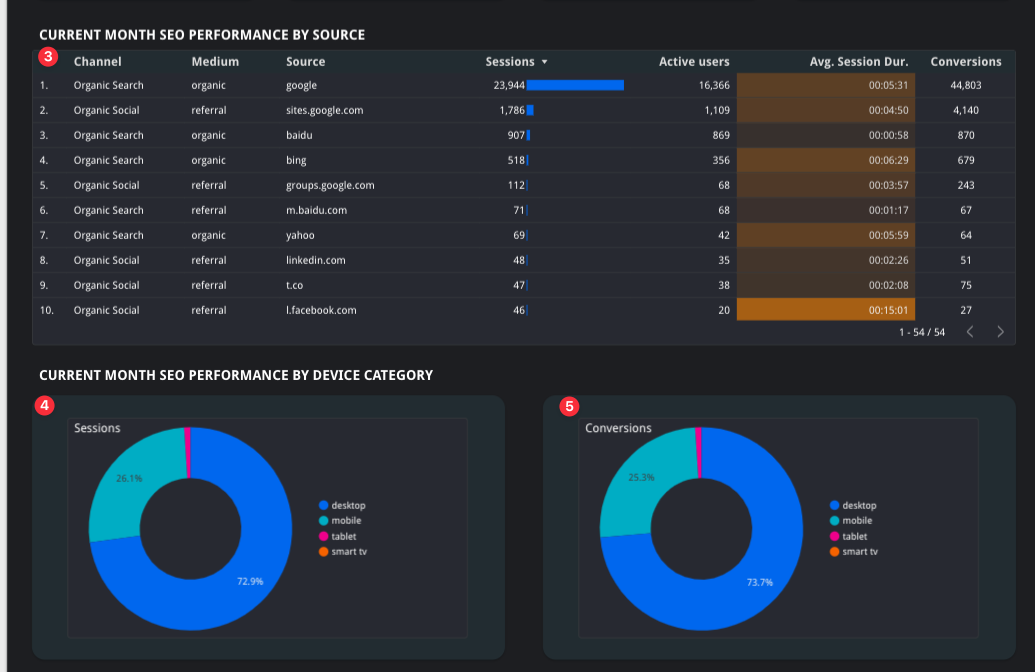
3- In this table, you can measure your channel, source, and intermediary performance of the current month with the opposite metrics.
4- You can see the device breakdown of your organic traffic here.
5- You can measure the contribution of your organic traffic to conversions here.
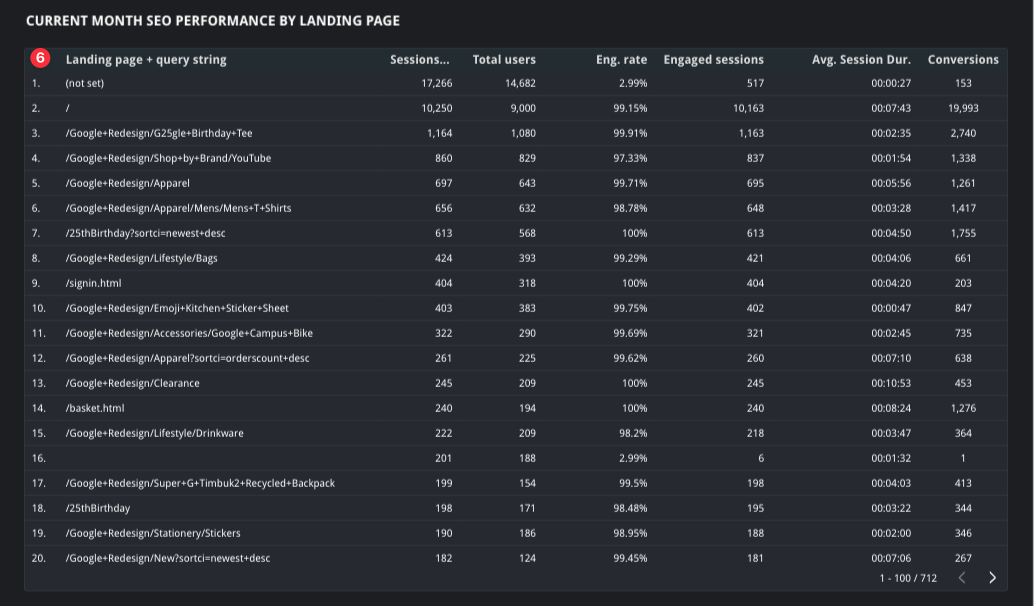
6- You can see the landing page reflection of your organic traffic from this table.
Last Words
In this guide, we have prepared a free Google Analytics 4 reporting template for you. Our goal is to help you improve your analytics skills and get the most value from your data.
We hope that our template will make your work easier and give you new insights. We are happy to support you in your data-driven decision-making. If you have any questions while creating the report for yourself, please do not hesitate to contact me at zafer@zeo.org.


