


Conversion Structure & Conversion Creation in Google Analytics 4
Google Analytics 4 introduces the metrics we characterize as "Goals" in Universal Analytics as conversion. We see that not only has the name changed, but also many new changes have been made in goal metrics, which is one of the most important metrics for us in GA4. This article will examine the concept of conversion and what we should pay attention to in conversion setups.
In the old Analytics version, we could define a maximum of 20 goals. In GA4, this number is 30. We can have a maximum of 30 conversion events in each GA4 data stream. This number is evaluated as 50 if we are using GA4 360. Speaking of events, it should be noted that since every action is an event in GA4, our conversions are also events.
Along with the conversions, we will create ourselves in GA4, there are some conversion events that are built into GA4. Let's take a look at them first.
Built-in Conversion Events
Each GA4 property has some built-in conversion events. Most of these events are related to mobile apps and each one is named as follows;
- purchase (web and app)
- first_open (app only)
- in_app_purchase (app only)
- app_store_subscription_convert (app only)
- app_store_subscription_renew (app only)
In order to activate the Purchase event, a number of advanced setups are needed. As it is related to e-commerce, it is a topic that can be covered in a separate blog post.
How to Create a Conversion?
To create a Conversion, we first need to create an event. Basically, if we want to track a final page, we can create this event through the GA4 panel. If we want to do more advanced tracking, we will need to create this event by GTM. Let's assume that we have a classical form, and when this form is successfully submitted, the user is directed to the sitename.com/thank you page. If we want to track every user who comes to this page, we need to follow the steps below.
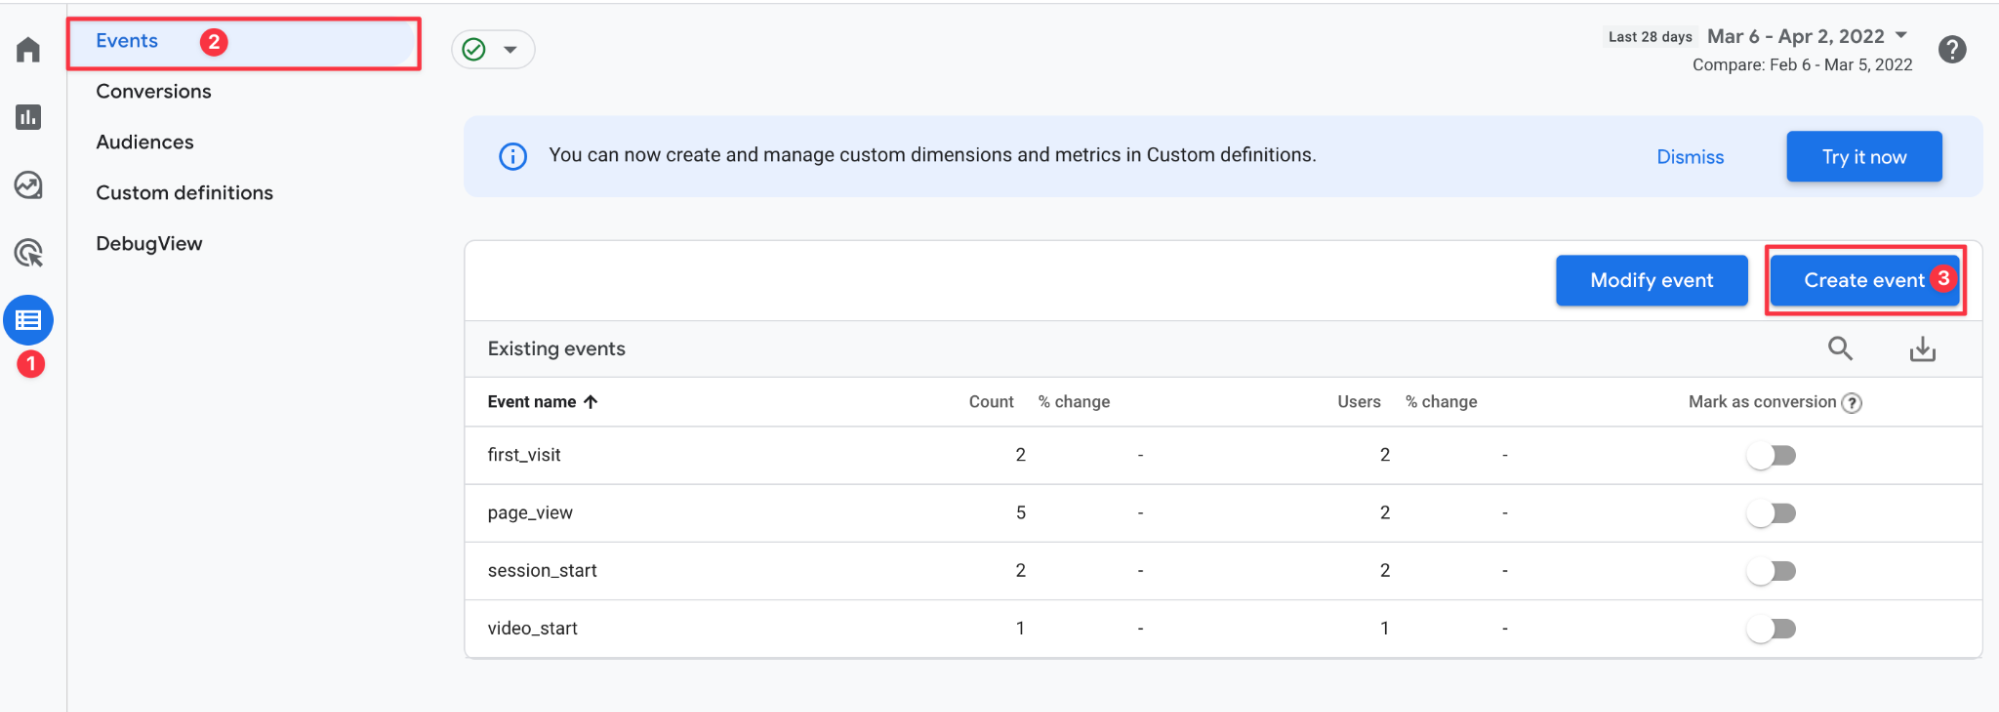
First, let's go to Configure > Events from our GA4 panel and then click on the "Create Event" button.
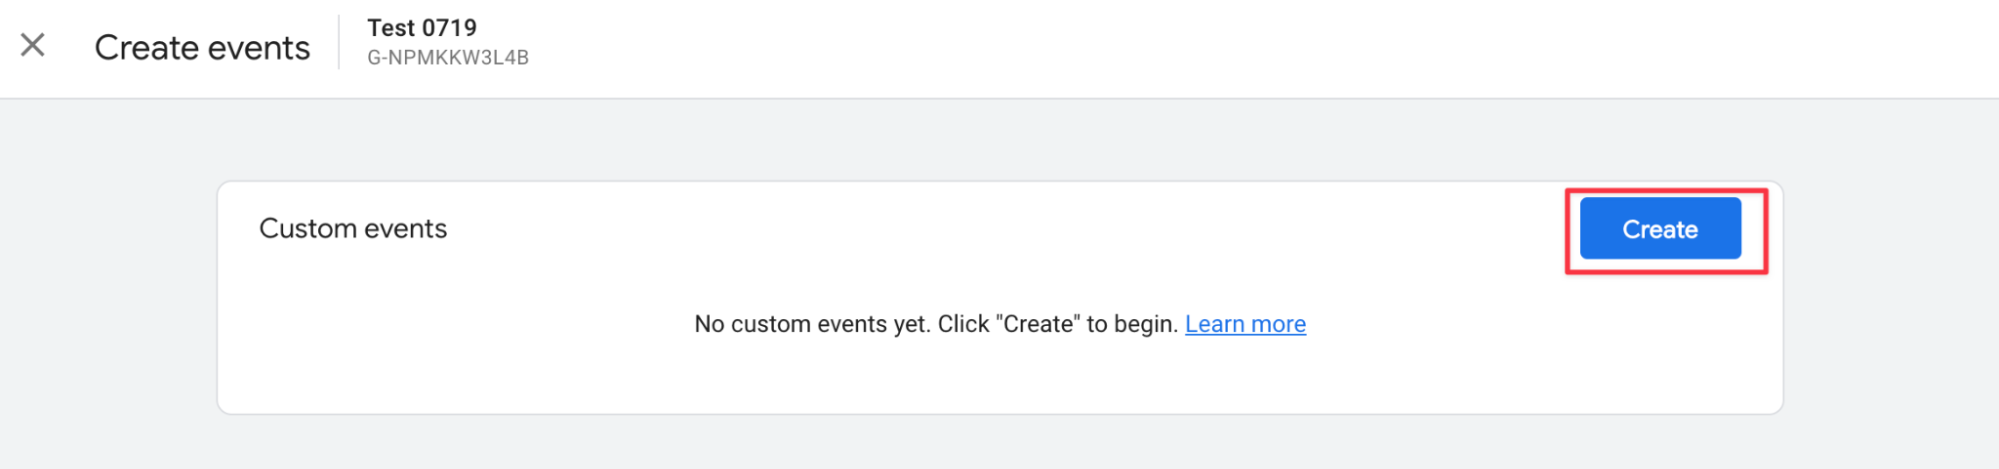
The "Custom Events" section will greet us on the page that opens. In this section, let's start creating the event we will specify as conversion by saying "Create" again.
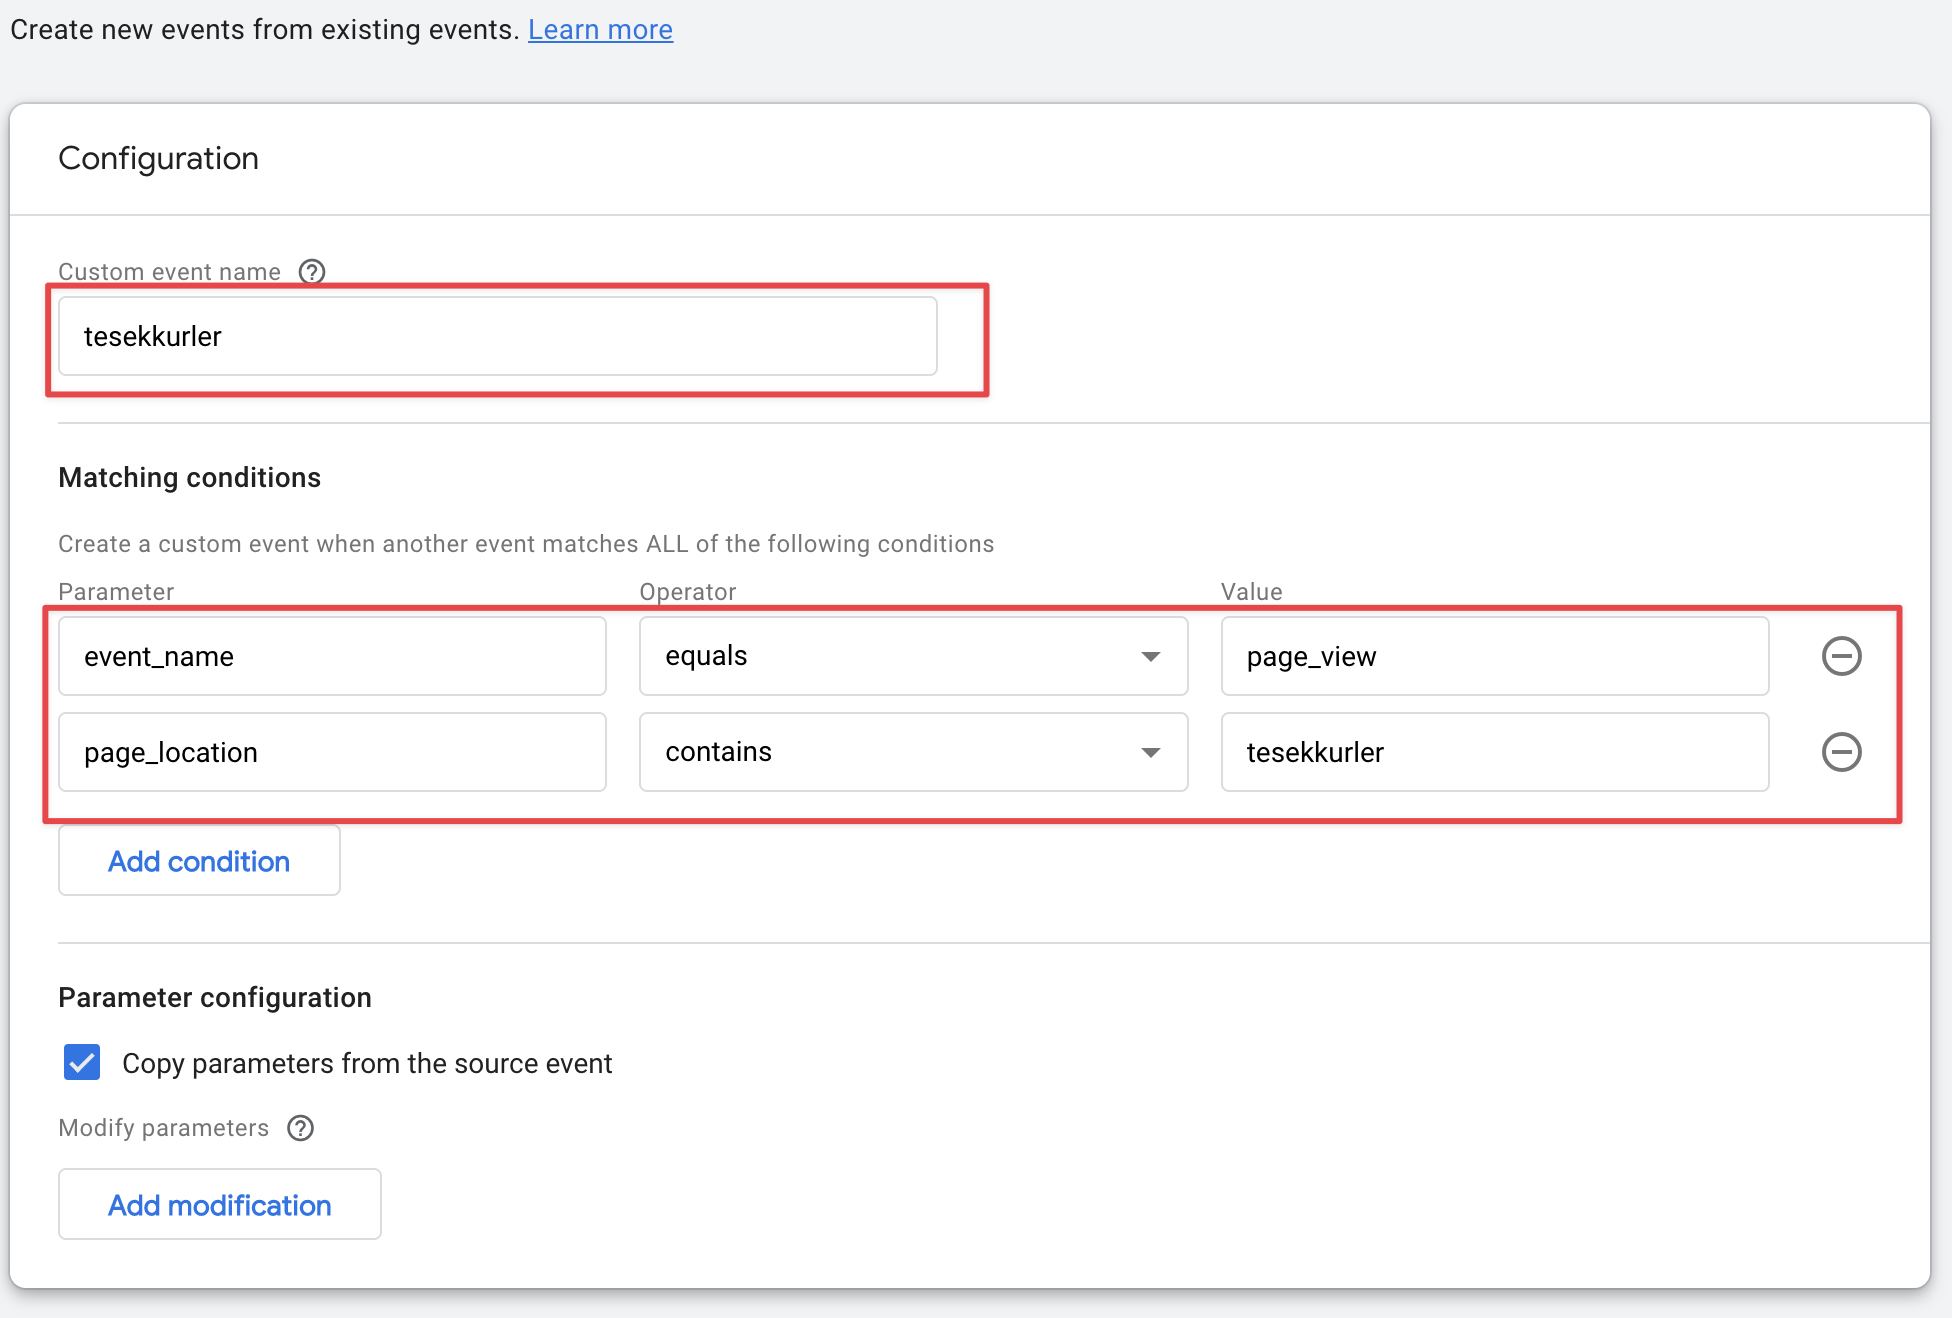
Let's specify a name with lowercase letters in the "Custom Event Name" section, if a name consisting of two or more words is to be entered, let's not forget to use the underscore "_" between them. In my example, I set the event name as "thank you".
The first parameter will be event_name and its value will be the page_view event. Then let's create our new parameter by clicking "Add Condition" under this parameter. The name of this parameter is page_location, the operator is "contains" and the value is "thank you" which is my page.
So what I'm saying is, if the URL contains "thank you", trigger and pass data to the event. Finally, I leave the "Copy parameters from the source" box selected, which means that I will also use the parameters from the original page_view event.
How to Convert an Event into a Conversion
We have created an event with the operations we have done above, yet this is not a conversion. We can turn it into a conversion without waiting for hours for the event we created to appear in the reports. This will ensure that we do not lose data and that our conversions are counted as soon as possible. Otherwise, it may take up to 24 hours for the data to fall into the event section.
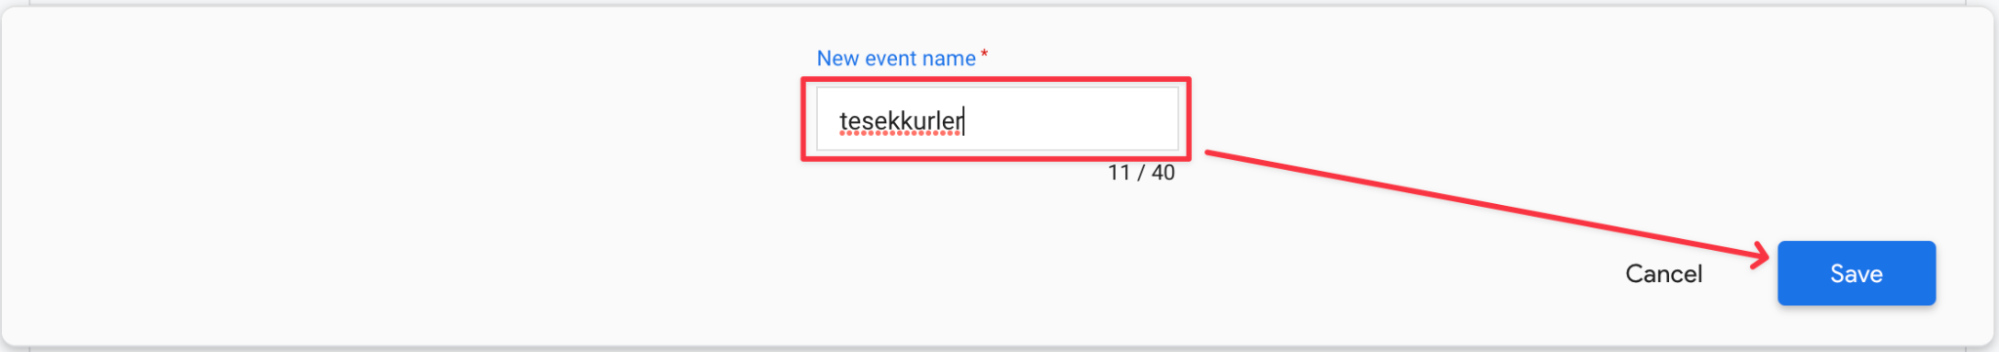
Again from the left panel, click Configure and select Conversions. Then, by saying "New Conversion Event", we write the event name we created in the field that opens.
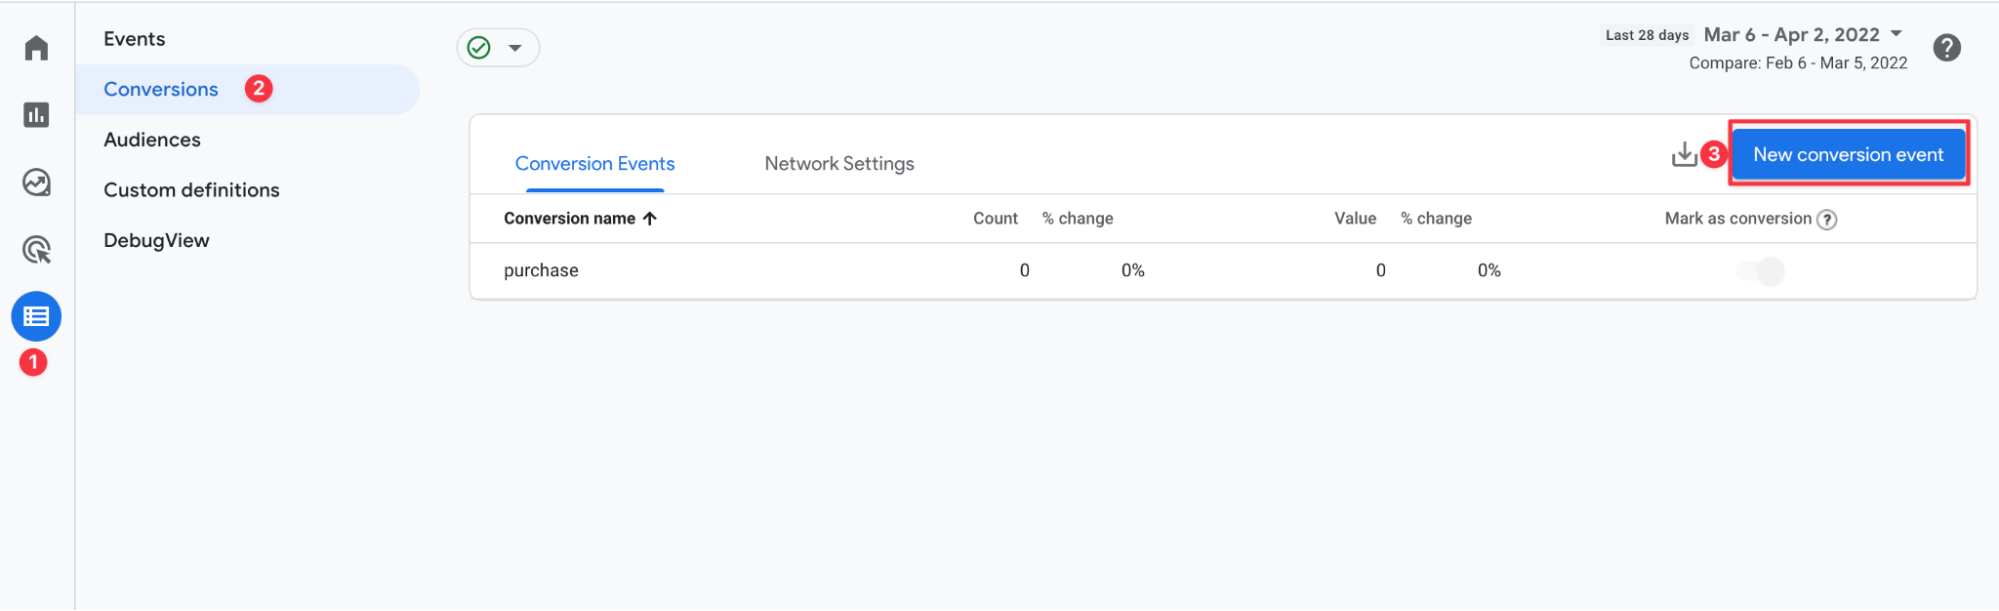
I specified the event name as "thank you". I type the same in this field and say "Save".
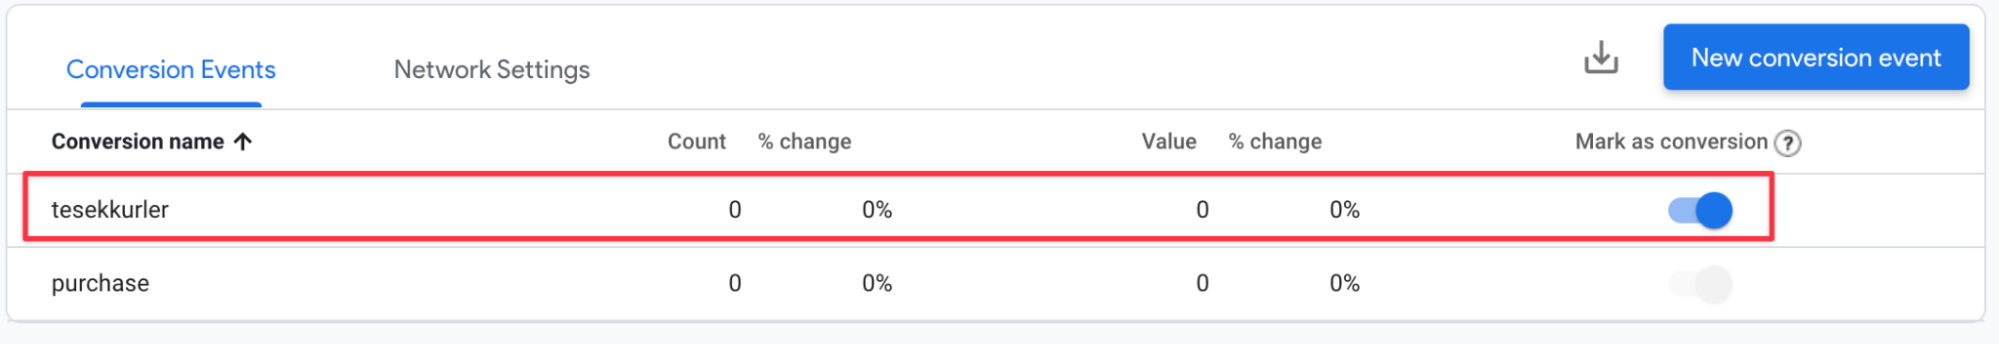
Immediately afterward, it will redirect us back to the "Conversions" section. Here I can see the "thank you" event that I just added, along with the purchase event that we mentioned before, which is built-in. I can stop or reactivate my event from the "Mark as conversion" field by coming to this area whenever I want. The only event that we cannot do this is the internal "purchase" event. GA4 does not allow us to make an edit on "purchase".
How Can I Test Conversion?
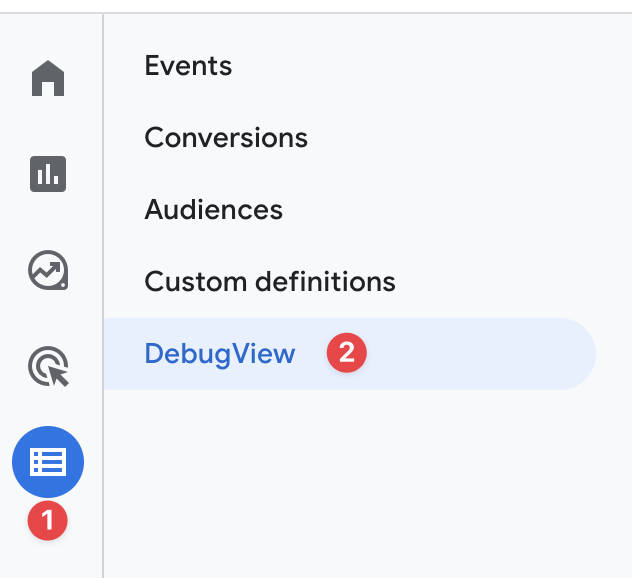
Everything looks great, but no matter how sure we are, we must test the installation. For this, we will use the "DebugView" area, one of the most excellent enhancements GA4 offers us. To access the DebugView area, we follow the Configure > DebugView path on the left panel.
We have 2 options for real-time debugging in the DebugView area; Using the "Preview" mode of Google Tag Manager or installing the Google Analytics Debugger plugin in our browser.
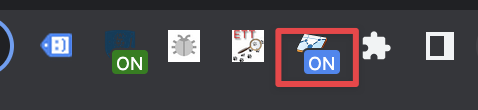
I used the DebugView field using the plugin. After installing the plugin, we open our site on Chrome, click once on the Google Analytics Debugger plugin, and turn it "ON". If you have a very high-traffic site and there are different people using this plugin in their browsers, you may spend a lot of effort to find your own actions in DebugView. :) It's not a scenario we may encounter often, but I wanted to mention it anyway.
After turning the plugin "ON", let's go to GA4 DebugView and give GA4 some time to see us. It will usually start seeing our actions within 1 minute.
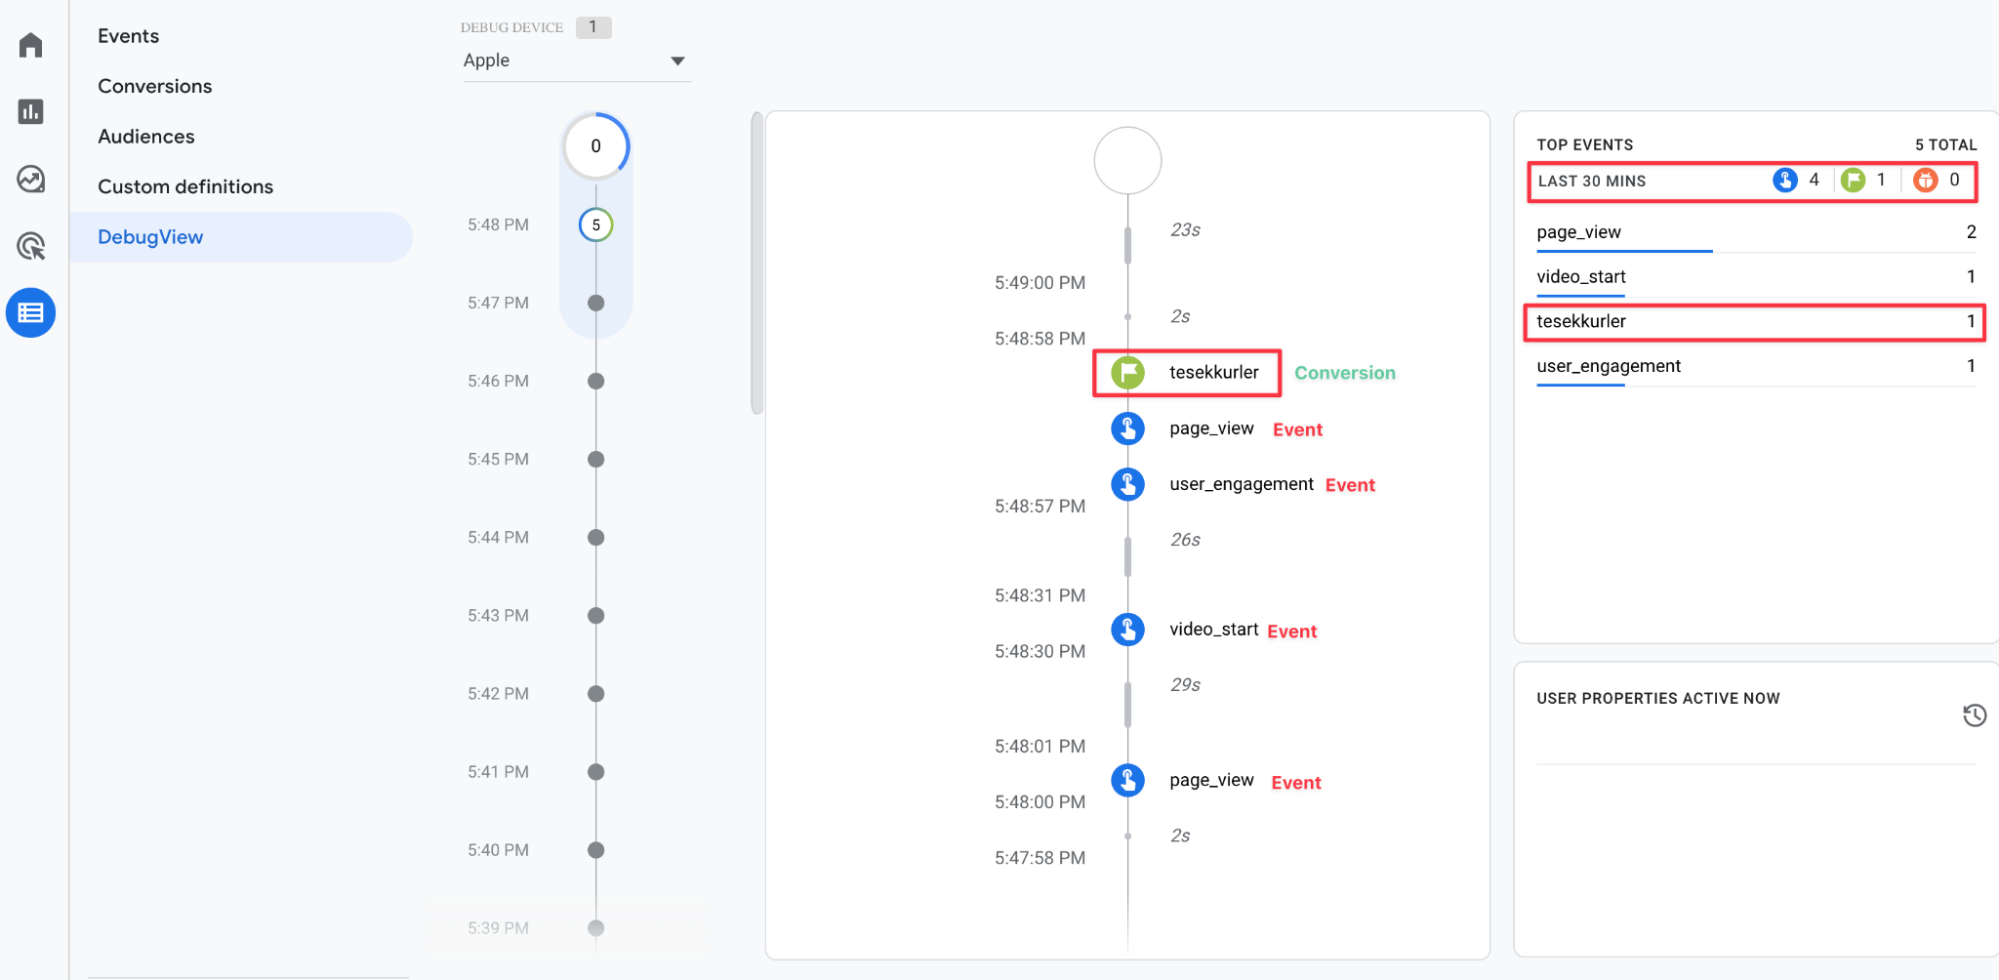
When I applied the steps I explained above, my actions were as follows. First I triggered a page_view, then I played a video on my homepage and triggered video_start. After the user_engagement trigger, I triggered a page_view again. But this was not a normal page_view, since it was my thankyou.html page, GA4 saw a conversion called "thank you" marked in green.
As you can see in the screenshot below, all events are marked with blue color while the conversion is marked with green.
In Which Reports Can Conversion Data Appear?
From the DebugView section, we made sure that our conversion event is working properly. Now, the conversion will be written when real users trigger this event. So where can we see the conversion data? We can view or use our conversion event in many report screens in GA4. Most basically, we can try to get the answer to the question "which traffic channel brings how many conversions?" as we did in the old Analytics version.
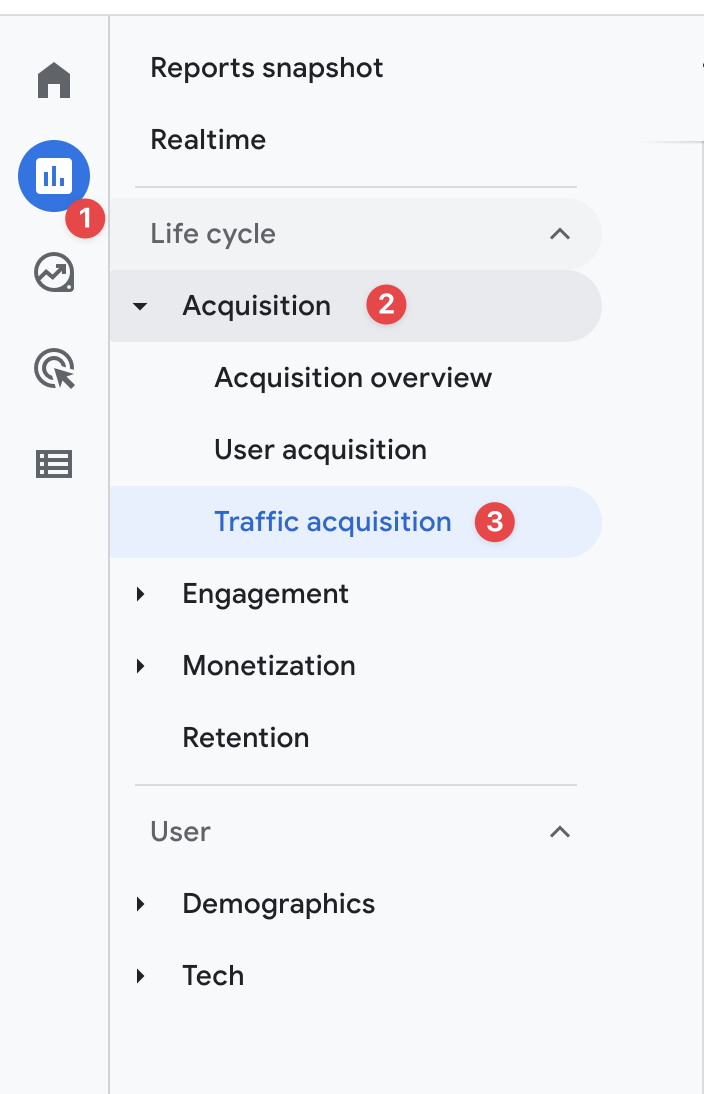
For this, let's go to Reports > Acquisition > Traffic Acquisition from the left panel.
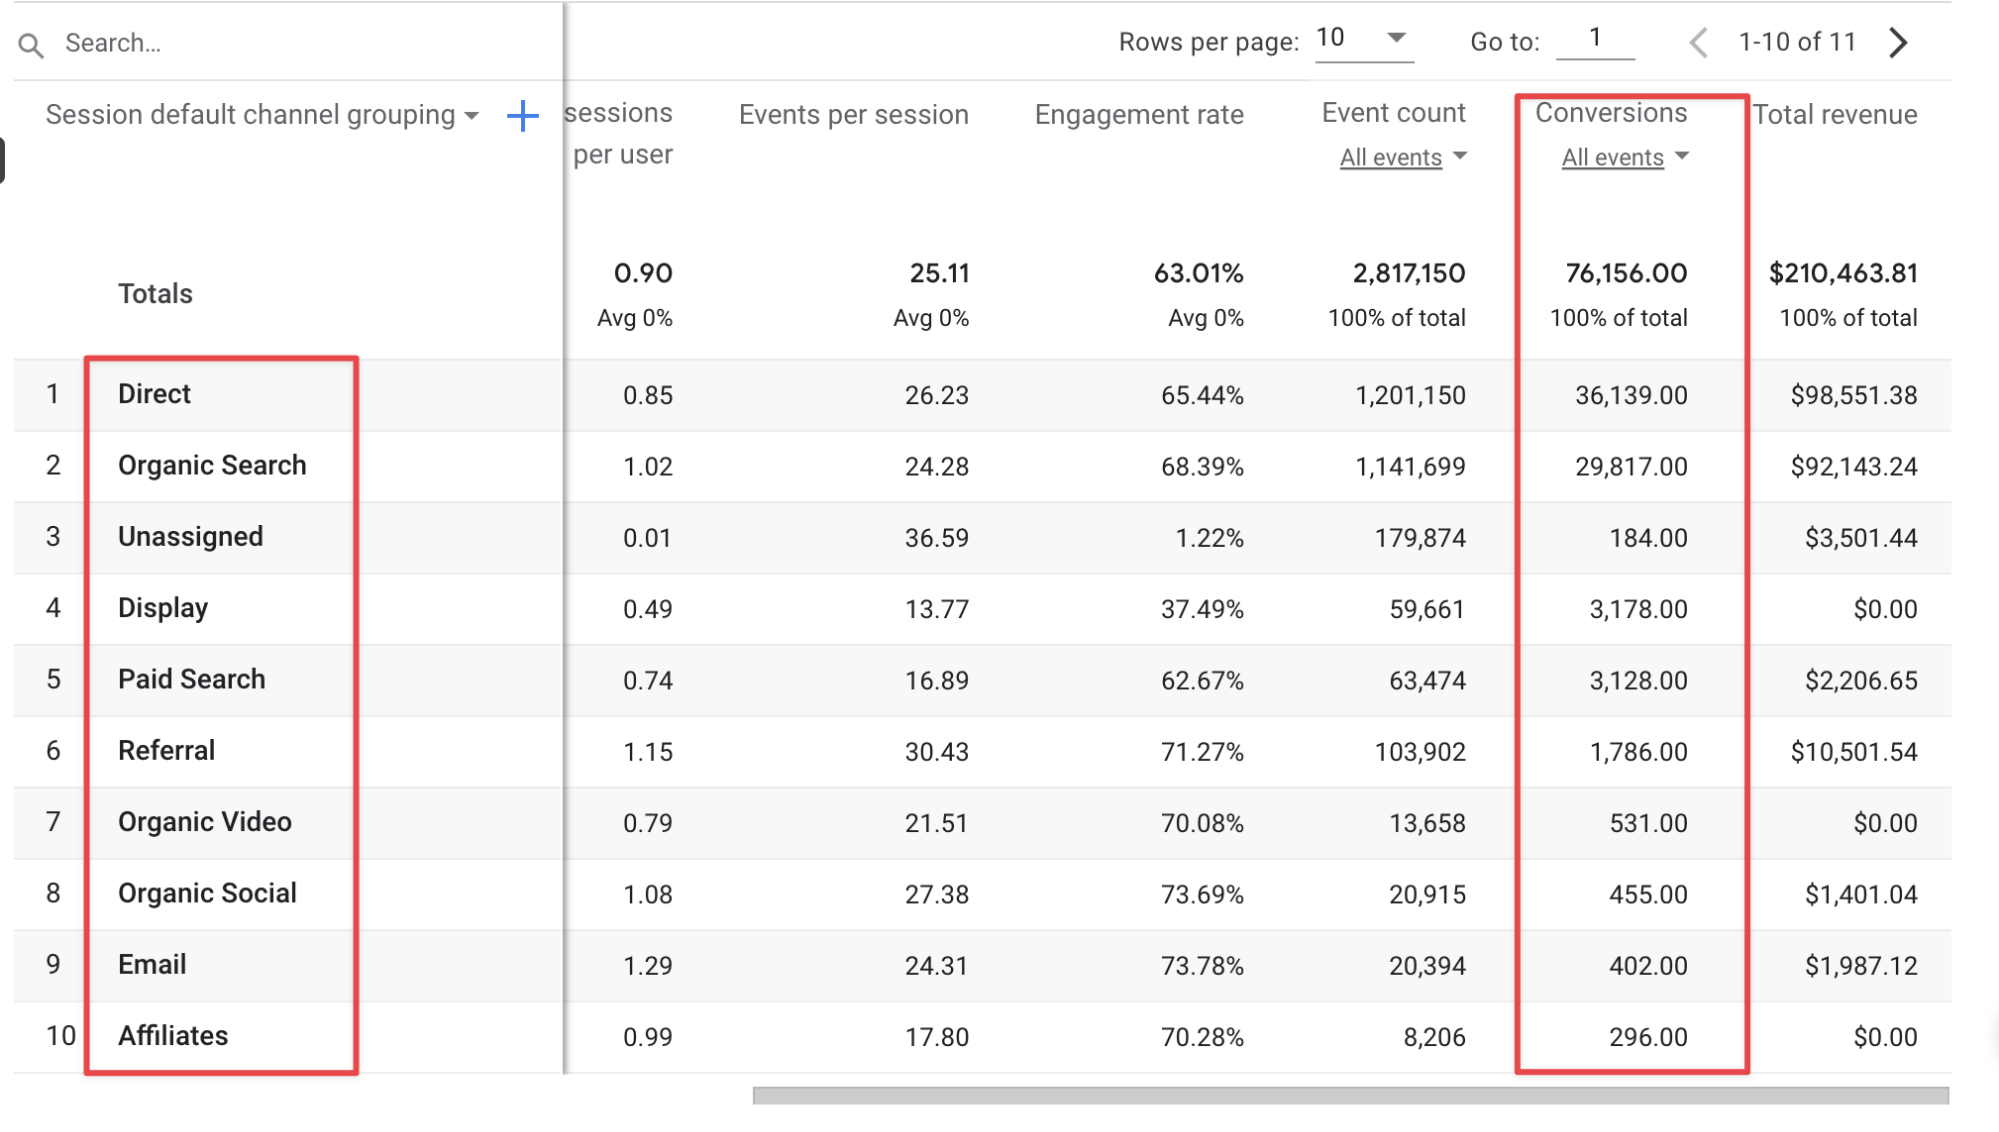
When we open the traffic acquisition report, we will see "Default Channel Grouping" on the left side, that is, our traffic channels. When we scroll to the right, we will see the "Conversions" metric. Here "All Events" is selected, if we do not change it, it shows us all our conversions. When we change it, we will only get the selected conversion data. It may take up to 24 hours for the conversion data to be reflected here. So I should mention that we are unlikely to see it instantly.
To show you, I go to the same area in the Google demo account and I see the screenshot below. Here we can clearly see how much conversion is obtained from which channel.
Bonus: Where is Conversion Rate?
There is not yet a metric called "Conversion Rate" in GA4. The reason I say yet is that many metrics and dimensions continue to be added. I think the "Conversion Rate" metric will be added in the future. So, if we need conversion rate data now, how can we find a solution?
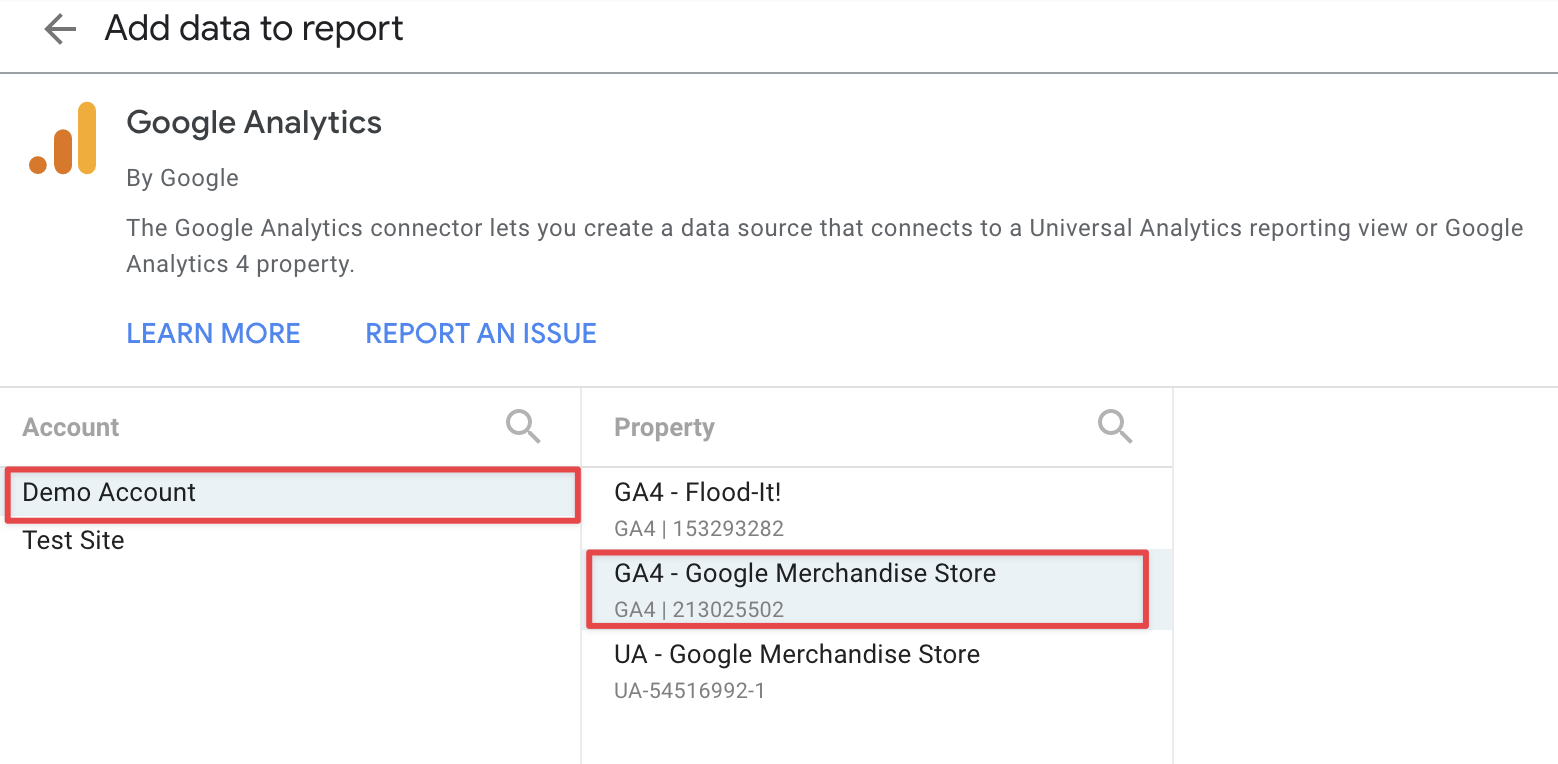
One of the tools that come to our rescue is Data Studio. By entering Data Studio, we create a new report and connect our source. I will use Google Demo Account here.
After connecting our source, we add a Scorecard from the Add a Chart field.
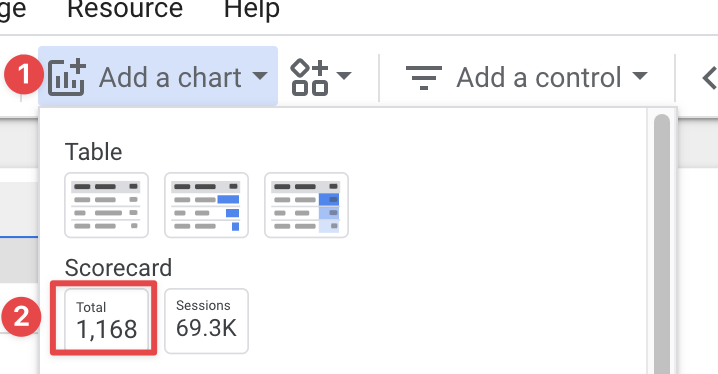
When we select Scorecard, the "Views" metric comes by default. We add a new metric by removing this part from the metric field and finding the name of our metric "Conversions".
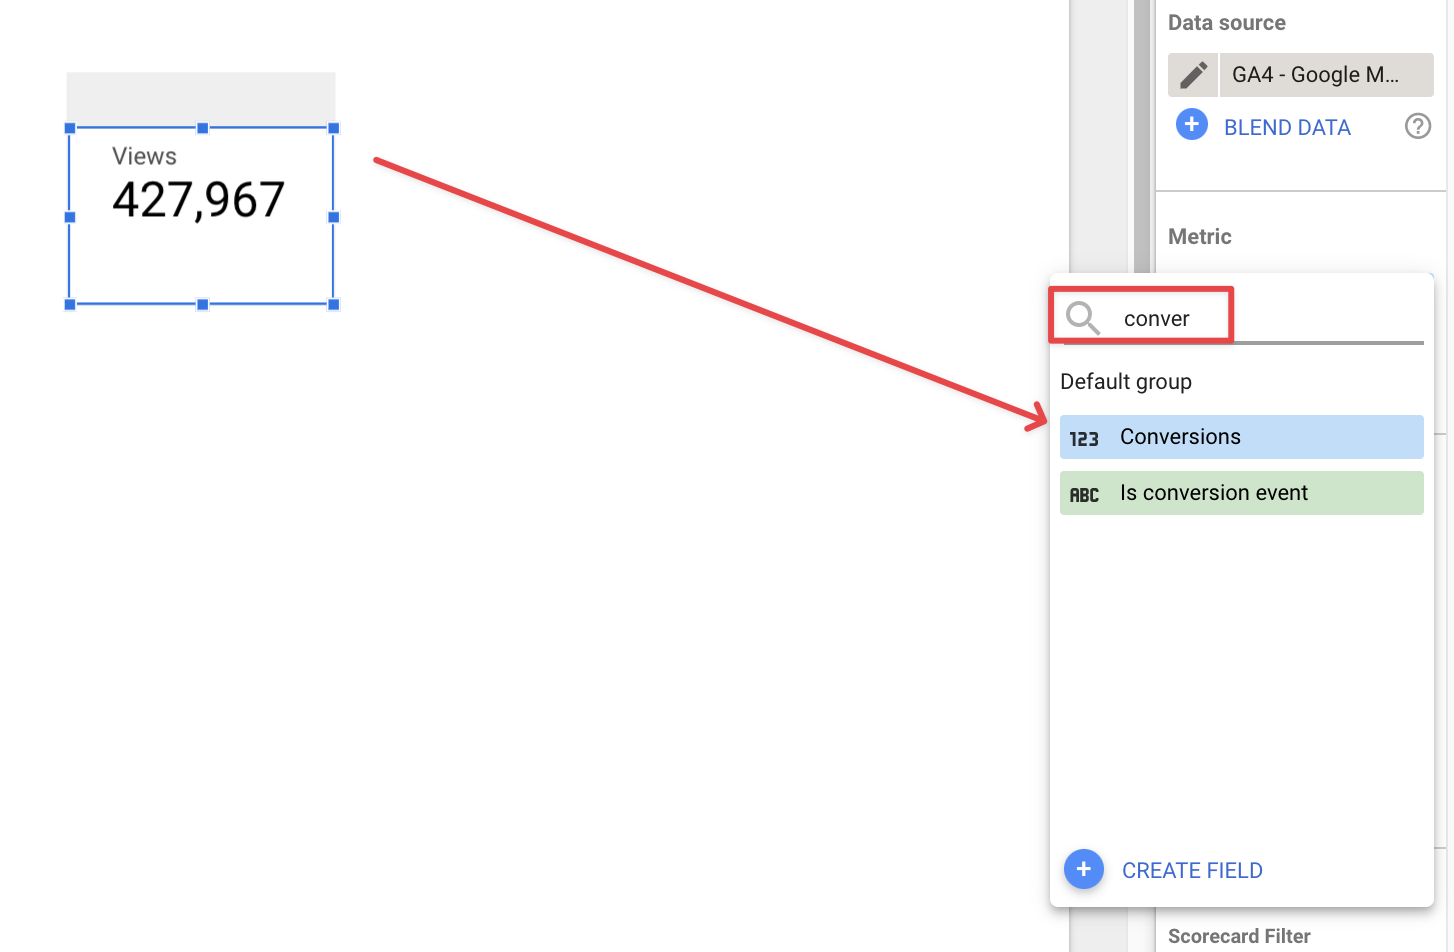
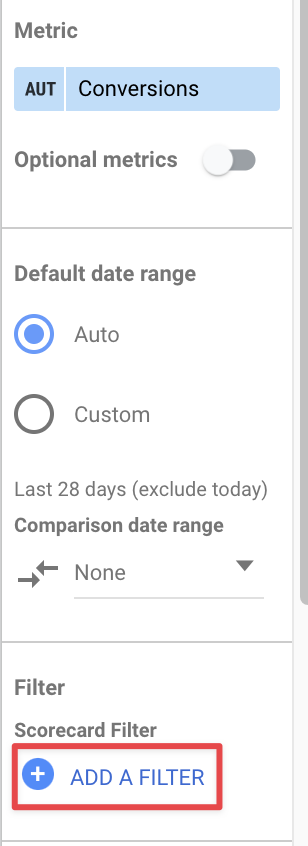
When we do this, it will give us the total number of conversions in the selected date field on Data Studio. If we have too many conversion events, this may not fully meet our needs. If I want to see the data of a specific conversion event, I will need a filter. So I click on "Add a Filter".
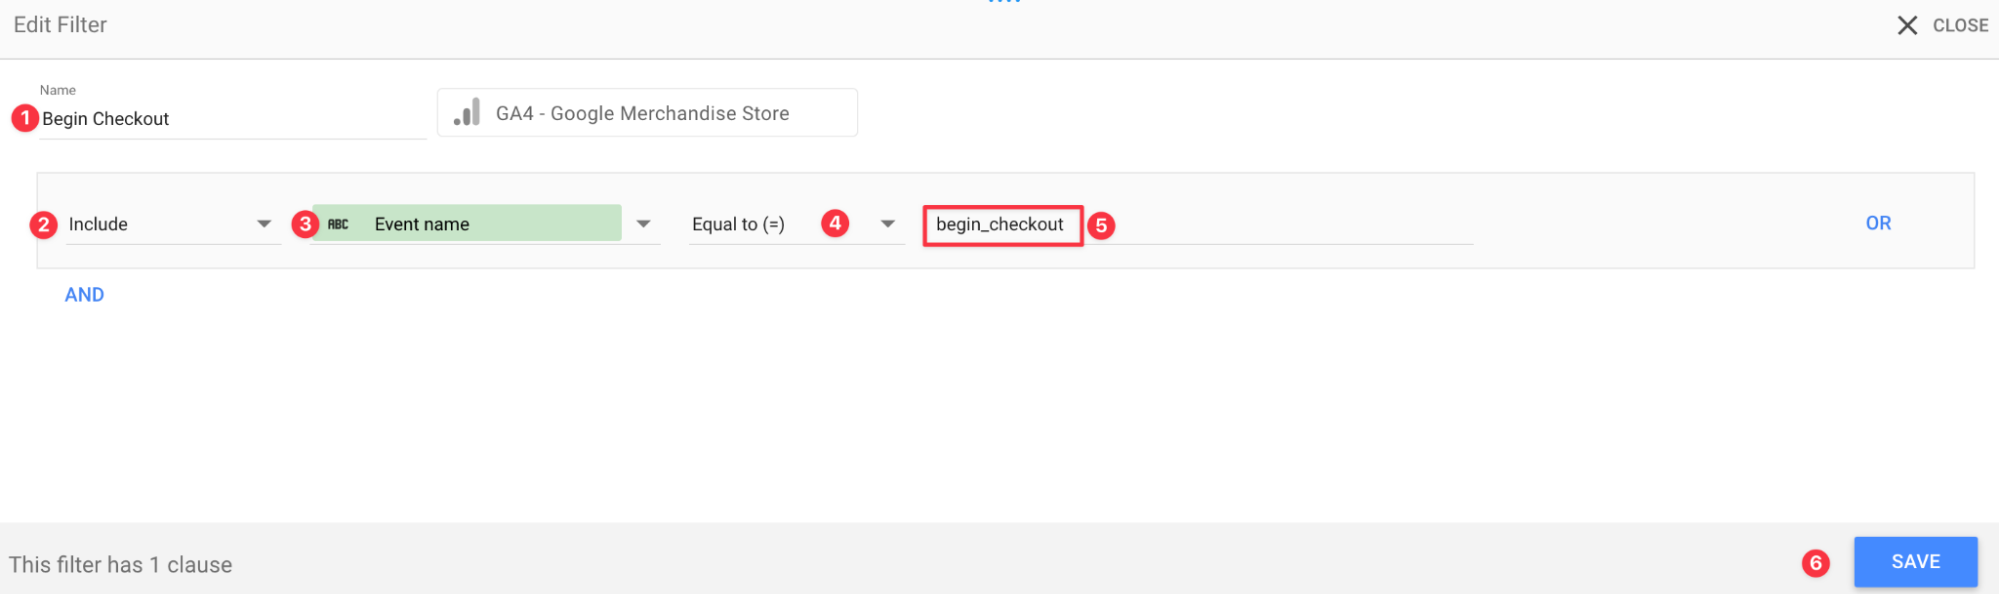
In the window that opens, I make filtering as follows:
Name: Begin Checkout (You can put the name you want.)
Include: Will remain selected.
Dimension: Event Name
Equal to(=): begin_checkout (The conversion name in GA4. You should write your own conversion name value here).
When I say Save, I will now only see the data of the begin_checkout event in my scorecard.
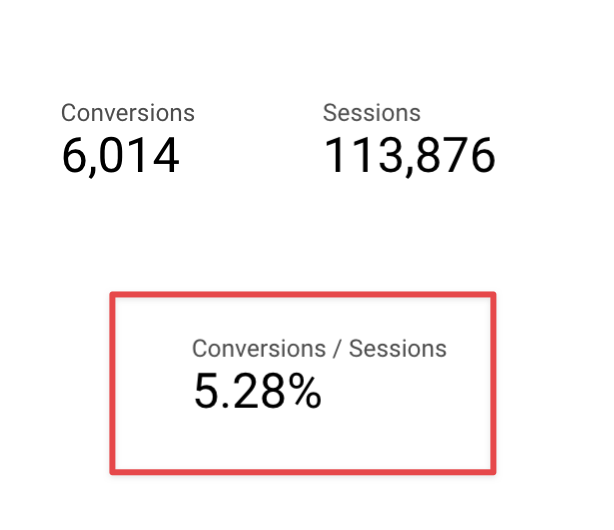
Immediately afterward, I add another Scorecard where I select the "Conversion" metric I mentioned above and pull the "Session" data.
Then I select both Scoreboards and right-click and select "Blend Data".
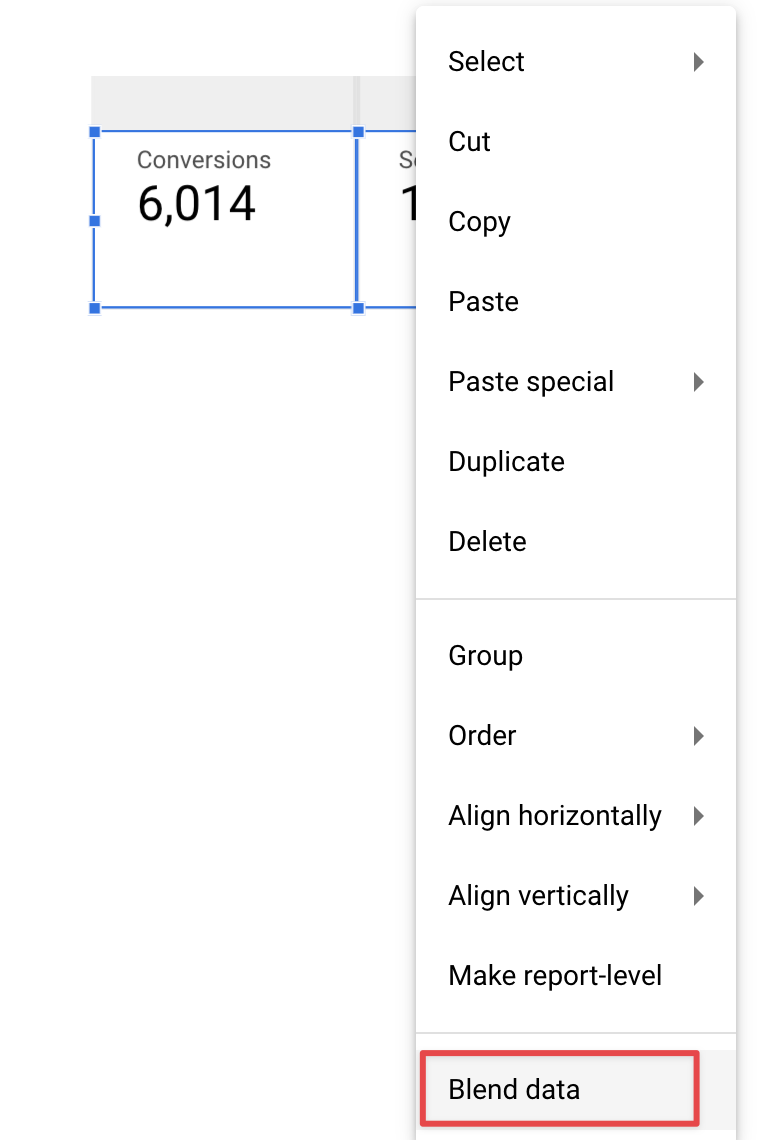
When we do this, it shows another Scorecard with Conversions/Sessions and the data here is our Conversion Rate.
I hope this article has helped you understand the "Conversions" structure in the Google Analytics 4 tool. GA4 is evolving and gaining new features every day. As with each dimension or metric, the "Conversions" field can be renewed and finalized over time. As of the current period, I hope this article will be helpful in tracking conversions and finding Conversion Rates.


