


How to Optimize Core Web Vitals? Comprehensive Checklist
In this article, I will talk about Core Web Vitals metrics and how we can optimize these metrics.
I will try to explain a checklist of 27 items that you can use to audit a website in terms of Core Web Vitals, i.e. Google speed and performance metrics.
The focus of our article will be on how to implement the Core Web Vitals audit step by step, which tools we can use, and as a guide on improvement actions.
First of all, I would like to briefly talk about Core Web Vitals and its importance.
What is Core Web Vitals?
In July 2021, Google started rolling out what they called the Page Experience Update, which was completed in September 2021.
For more news on this and other Google updates affecting search and rankings, I recommend you follow Google Search Central. I also highly recommend the Google Search Central YouTube channel. Here is the link to the last episode where John talks about this latest update, which was released in March 2022.
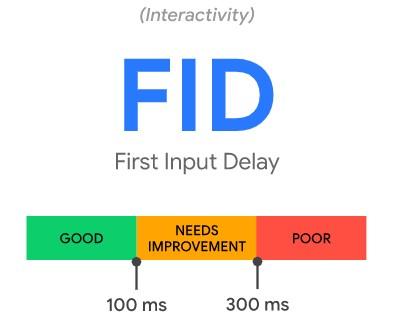
Core Web Vitals is a set of three different metrics related to the loading, interactivity, and visual stability of websites: Largest Contentful Paint (LCP), First Input Delay (FID), and Cumulative Layout Shift (CLS).
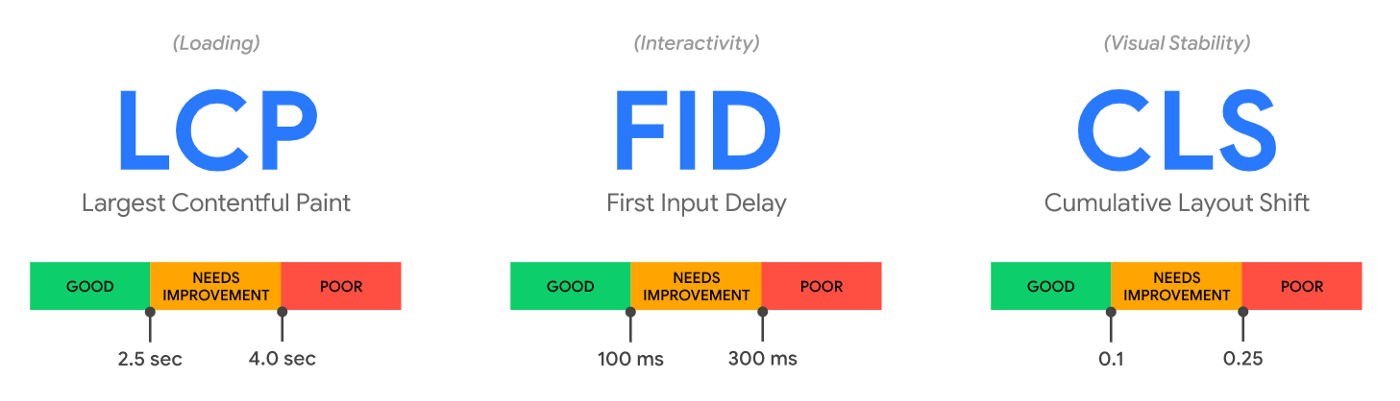
- Largest Contentful Paint (LCP) - Measures page load performance. LCP should occur in less than 2.5 seconds.
- First Input Delay (FID) - Measures the speed of interaction / the time your page takes to respond to user action. FID should be 100 milliseconds or less.
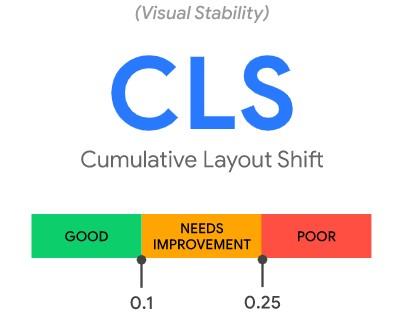
- Cumulative Layout Shift (CLS) - Measures visual stability. CLS should be 0.1 or less.
One of the most important details to know is that lab data (shown in Lighthouse reports) is not a ranking factor. Therefore, you'd better trust PageSpeed Insights or CrUX Dashboard, both of which use on-site data from real users. This data, which Google uses to rank websites in organic search, comes from the Chrome User Experience Report (CrUX), a public dataset of real user experience data across millions of websites.
Core Web Vitals is one of the page ranking factors, so it will definitely be beneficial for you to put some extra effort into it and improve your site in this regard.
So Why Core Web Vitals is so Important?
- Core Web Vitals is one of the most critical parts of a great page experience.
- A web page that provides a great on-page experience is very, very likely to meet the needs of its users.
- If it's important to you that Google likes your website, then meeting the needs of your users and new users should be a key priority for you.
Google is very clear about this and tells us clearly what it wants.
- Google wants your website to have an excellent user experience.
- In order to provide this excellent user experience, you need to meet the three important metrics mentioned above and the related page experience signals.
Don't worry about this because according to a recent research study conducted by Advanced Web Ranking, less than 40% of the pages included in the analysis meet these evaluation criteria.
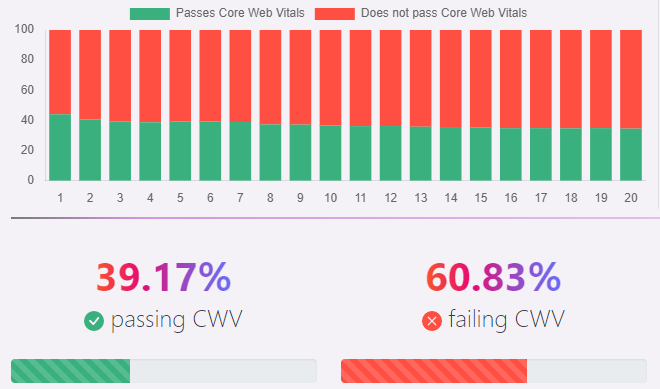
Desktop
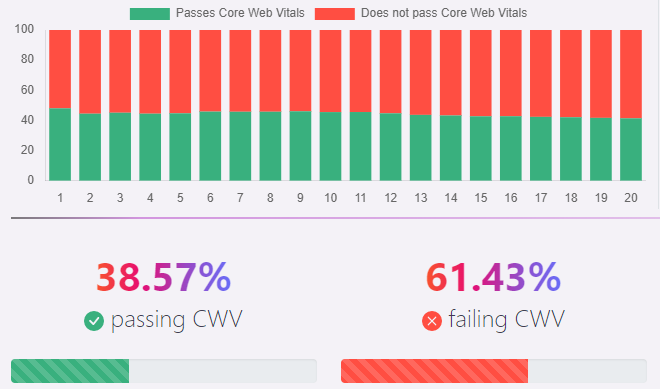
Mobile
But don't worry, don't miss the opportunity to get ahead of your competitors by deepening your work here.
I won't go into too much detail about Core Web Vitals, because there are so many resources on it and I've even linked to many of them in this article.
Google has also compiled a series of answers for anyone with questions about these metrics in this comprehensive Core Web Data FAQ.
Now you will learn how to do a step-by-step page experience audit. Now you'll start to learn how to do a step-by-step audit of what you need to do to improve Core Web Vitals.
First, we start with the tools you can use to perform a Core Web Vitals audit.
Which Tools Can You Use to Conduct a Core Web Vitals Audit?
Here are the tools we recommend you use to perform a Core Web Vitals audit. The more variety of tools you have for this audit, the more in-depth the audit you perform. Because each of these tools has its own strengths.
Measurement Tools for Core Web Vitals Audit
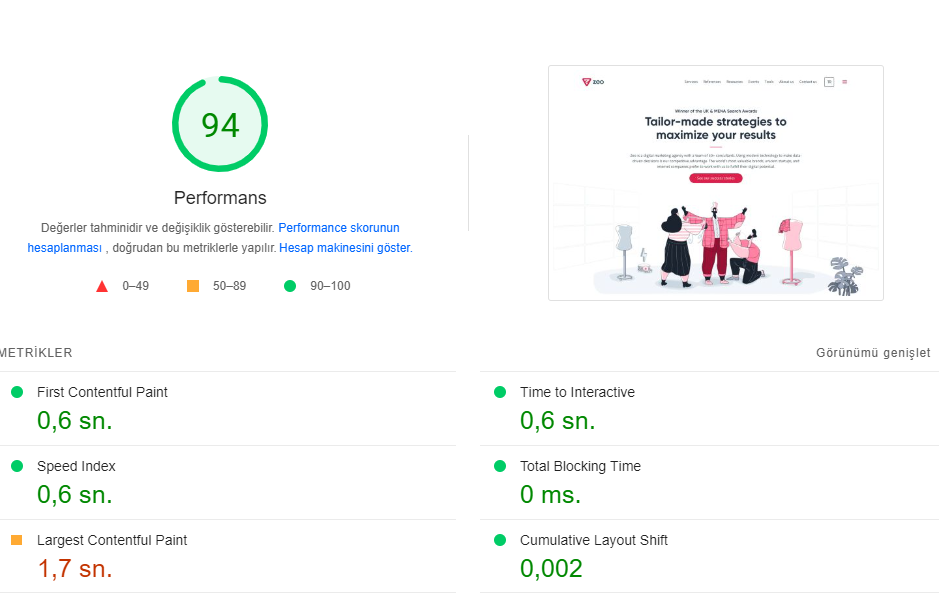
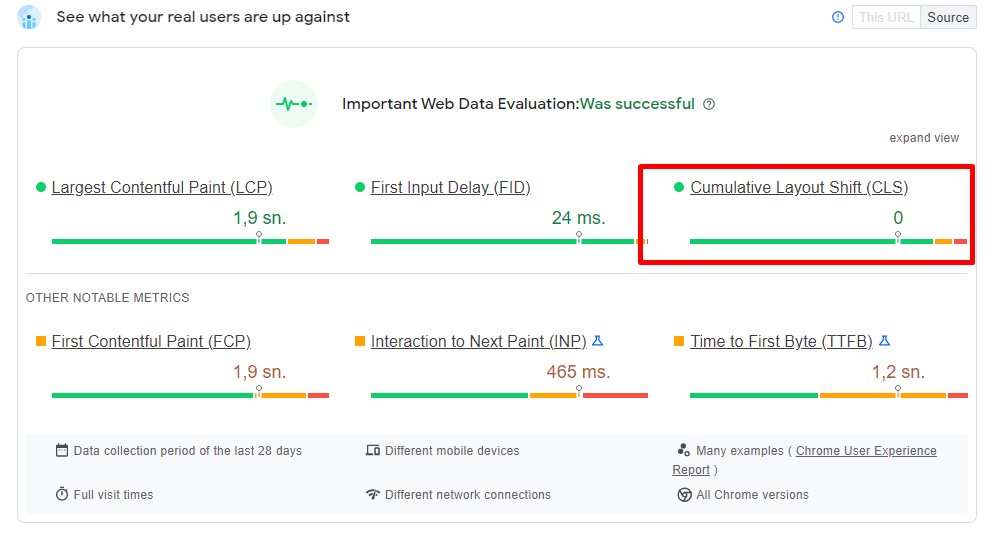
PageSpeed Insight is an important tool for analyzing Core Web Vitals metrics. Google PageSpeed Insights (PSI) is also one of the most prominent tools when it comes to CWV measurement and evaluation. PSI is powered by Lighthouse and Chrome UX Report, so it can present both lab and field data on mobile and desktop devices. In addition to providing an overview of field data from real-world users (CrUX), PageSpeed Insights gives you many optimization suggestions for your site on a page-by-page basis. PSI has a page-based system.
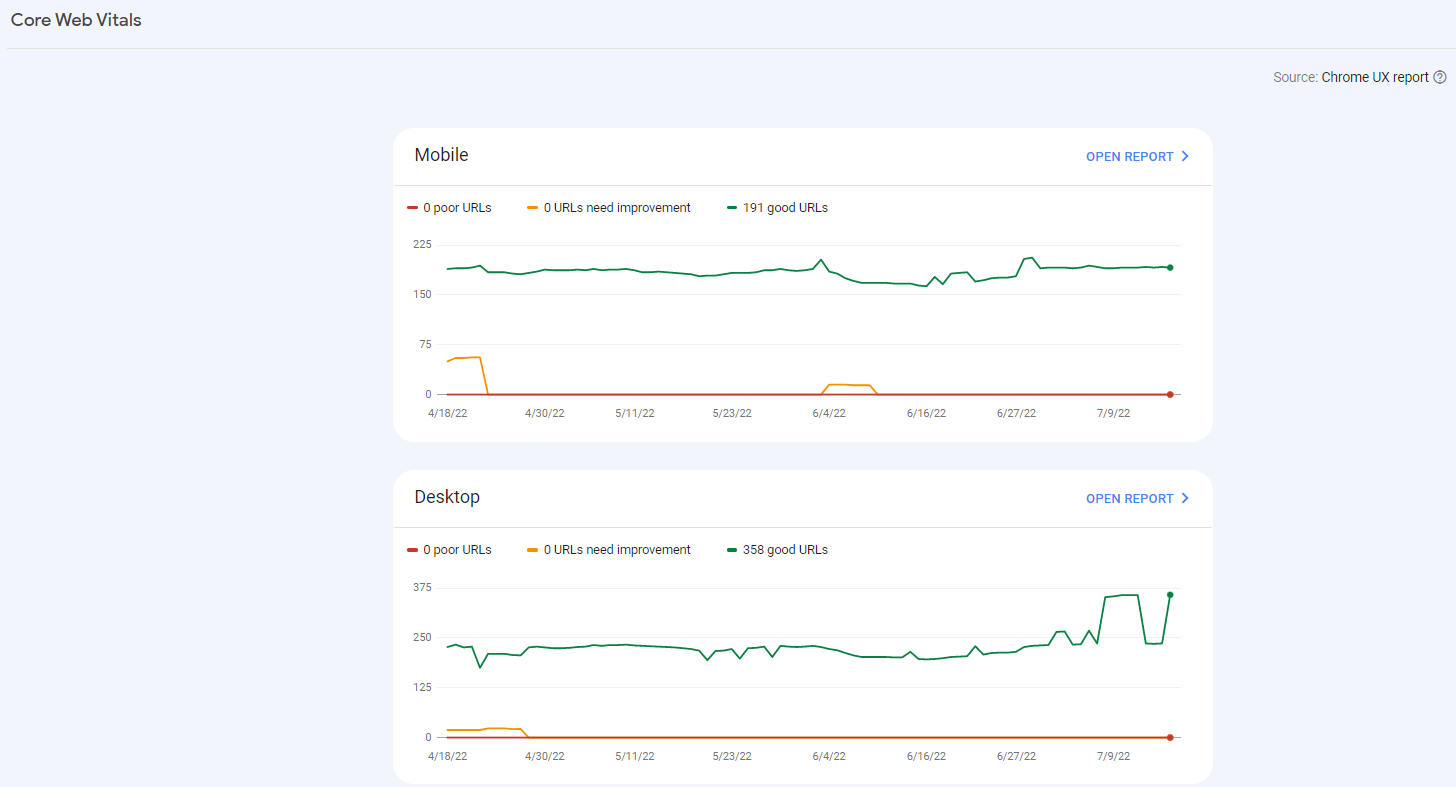
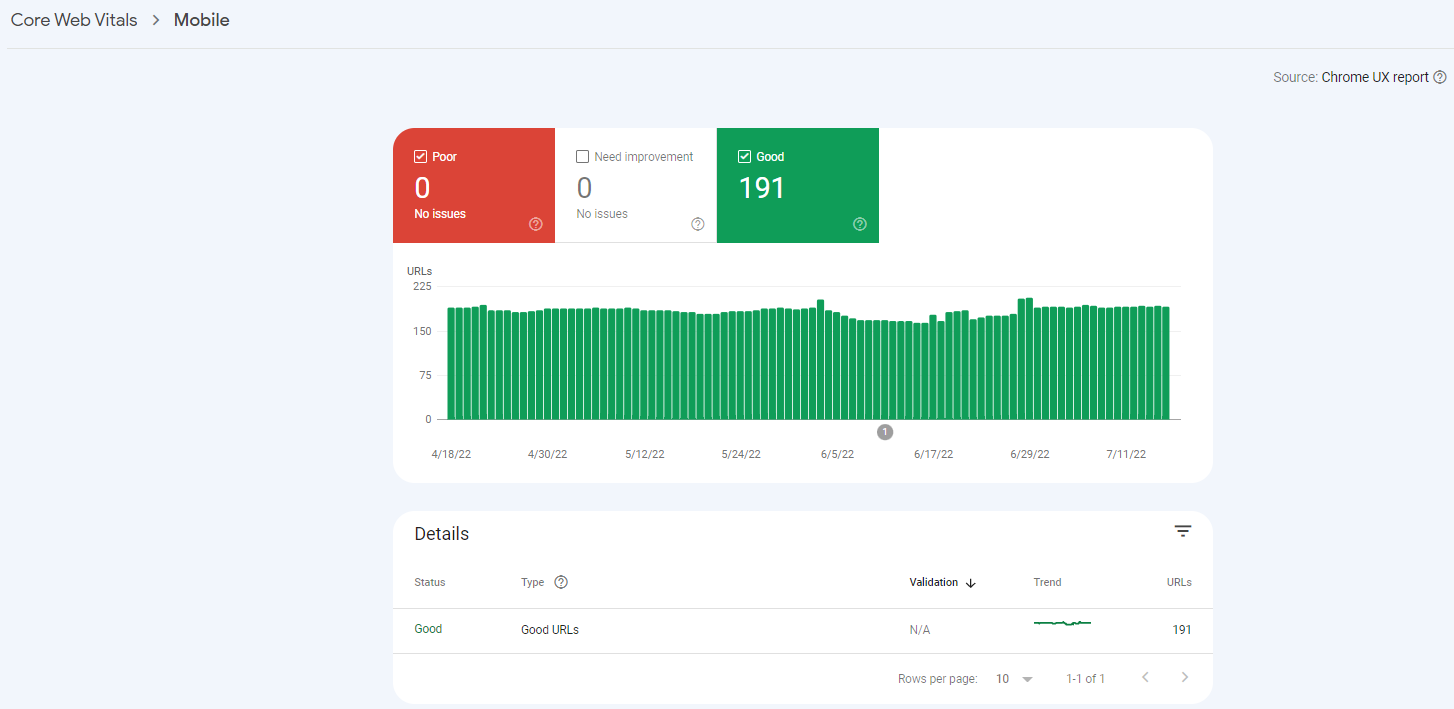
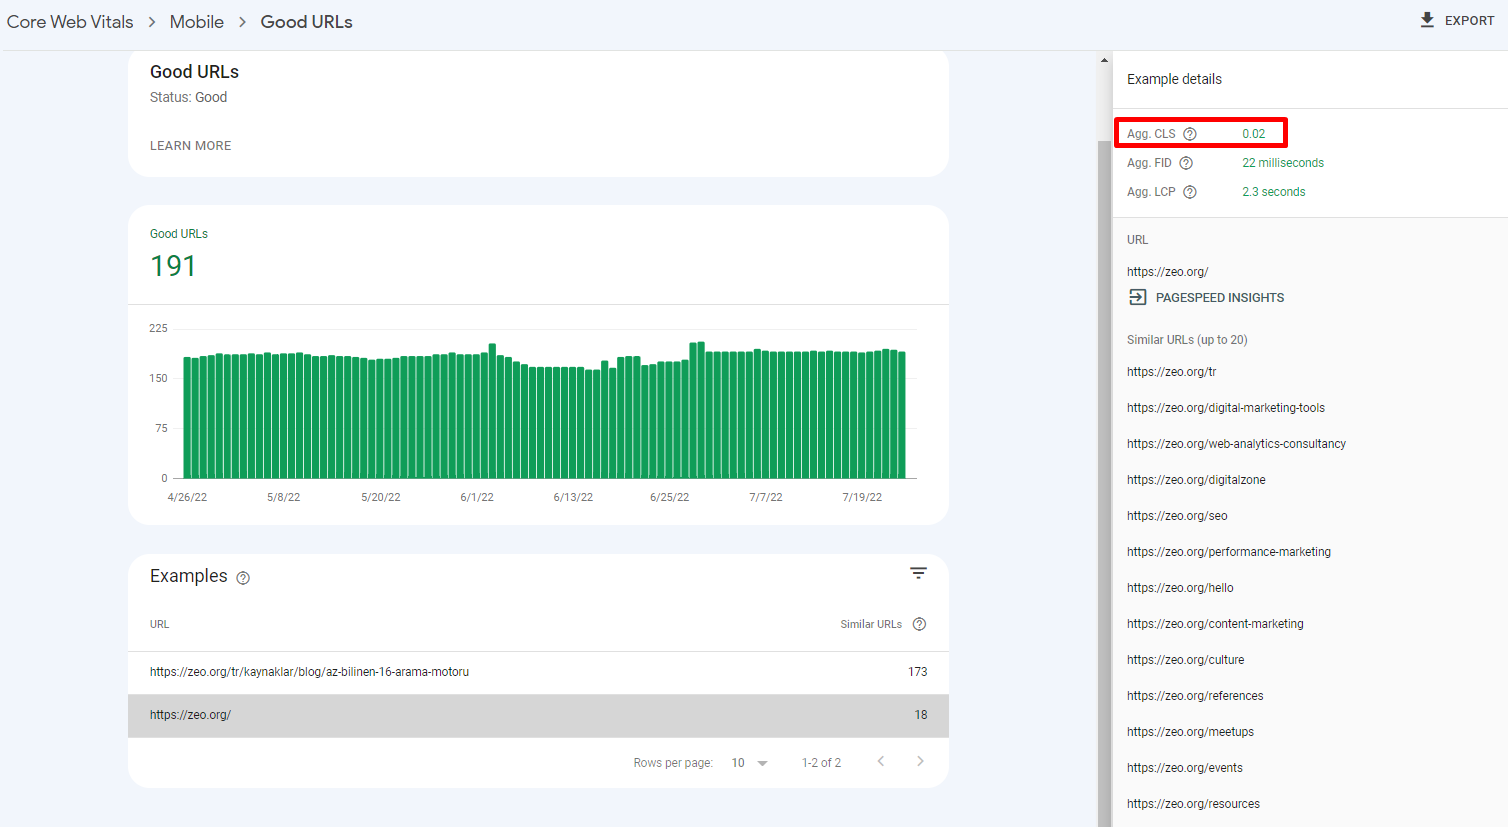
Google Search Console (Core Web Vitals Report) is a useful tool that gives you results on a page-by-page basis that you can use to analyze Core Web Vitals metrics in bulk. GSC provides us with real-world data based on the Chrome UX Report. URL addresses on our website are grouped according to their status (bad, needs improvement, good) and metric type. GSC CWV allows you to find out how all (or most) of your web pages are performing.
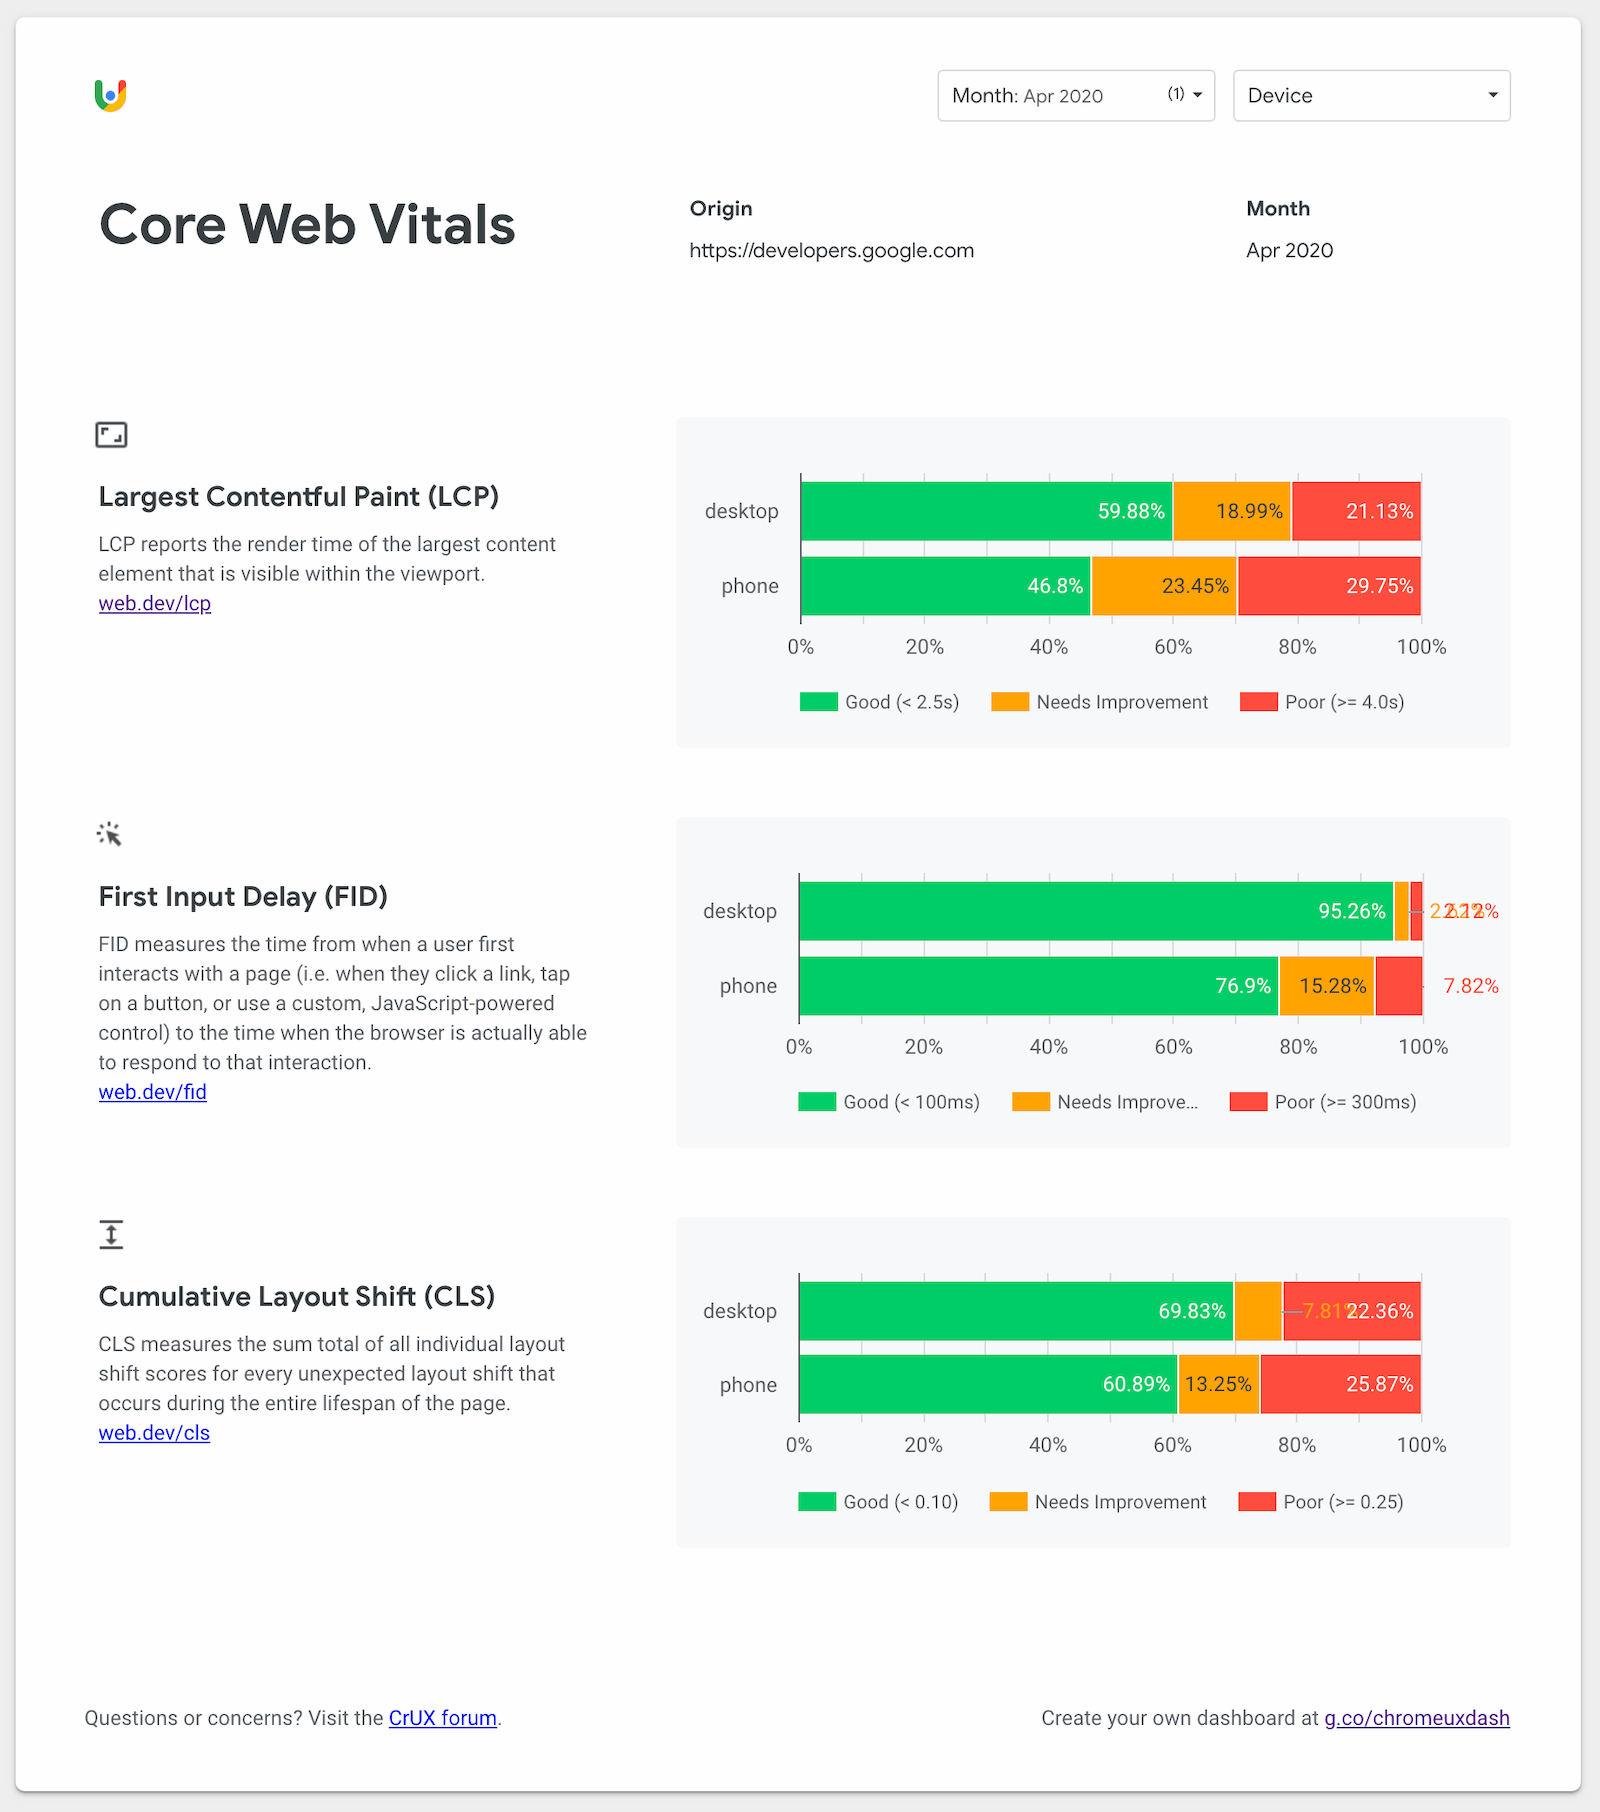
With Chrome UX Report, you can access the data collected by Google faster and more accurately.
The Chrome UX Report (CrUX) is not a standalone tool, but a public dataset of real-world user experience data from millions of sites across the ecosystem.
Chrome UX Report data comes from Chrome's active users, which means it measures site data across all CWV metrics.
You can access the Chrome UX dashboard report here.
web-vitals JavaScript library, If you are a developer and want to measure Core Web Vitals in JavaScript, you can use this library on GitHub.
Most of these sample tools provide real-world data on how real users experience a website.
There are also what we call lab tools that we use for auditing.
Lab Tools for Core Web Vitals Auditing
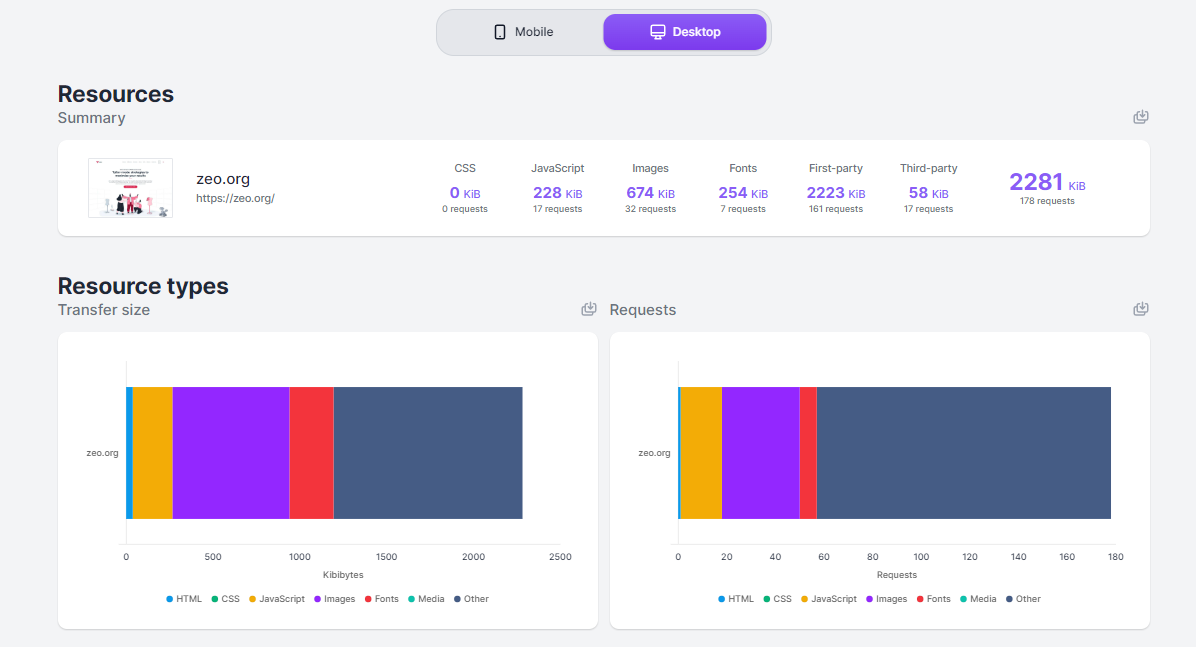
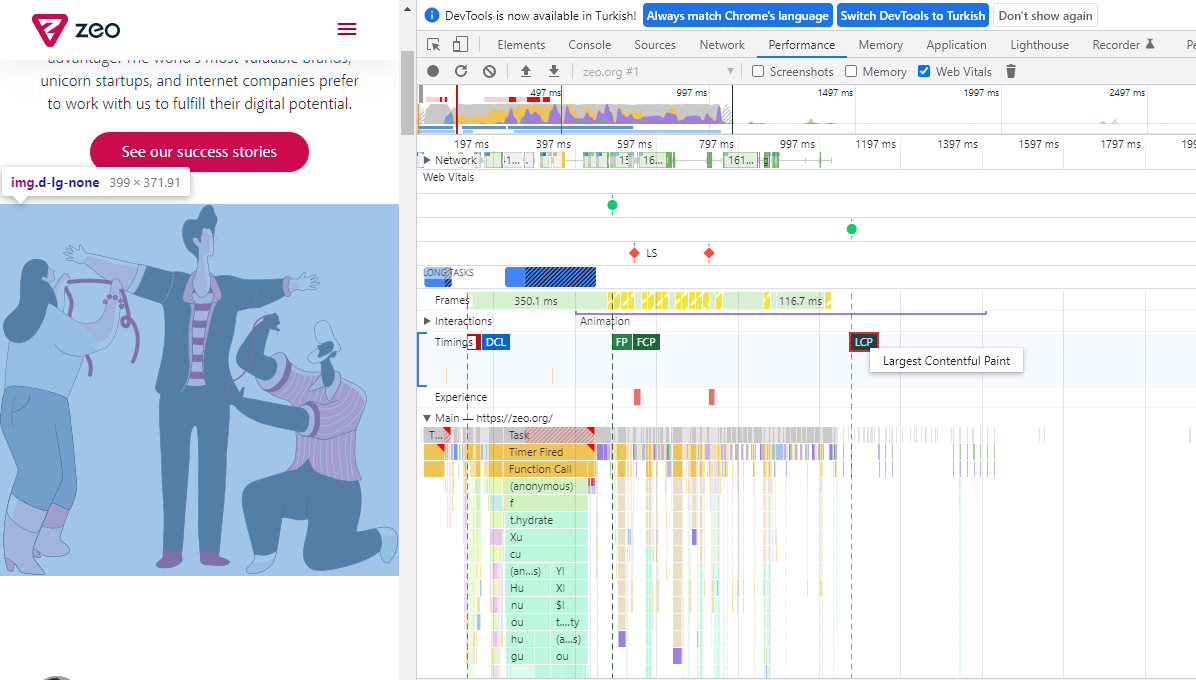
This tool can be used in many SEO optimization processes, providing us with in-depth information on how our site works in the Core Web Vitals audit with the Performance section in its structure, the loading stages of the files, and similar issues.
At the same time, there is explicit content on how to use this tool in SEO audit in ZEO Blog. You can reach me from here.
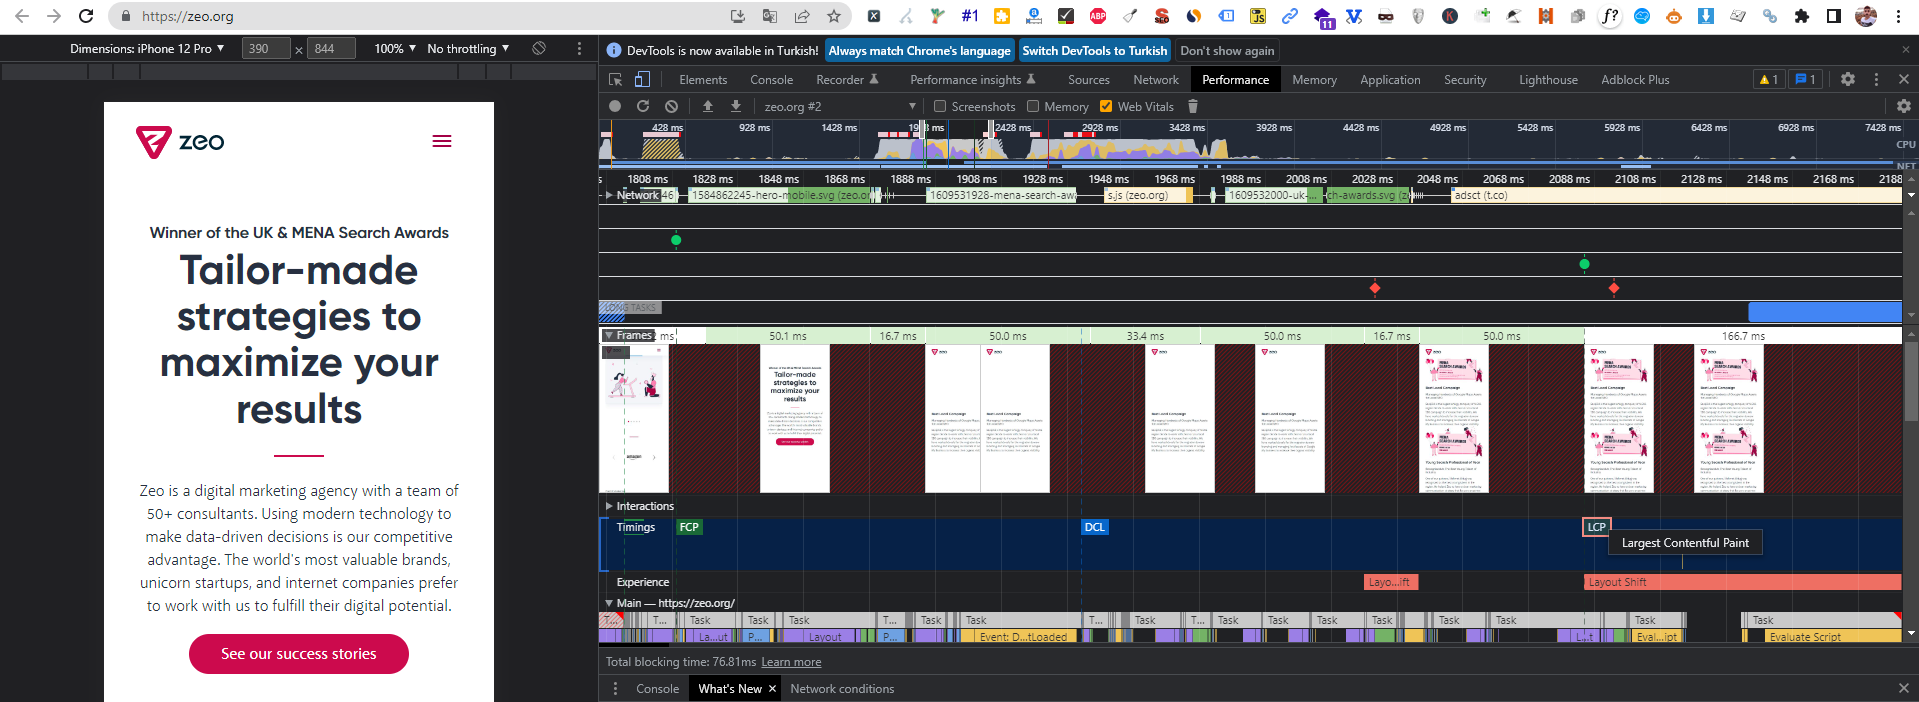
A screenshot for zeo.org from Chrome DevTools
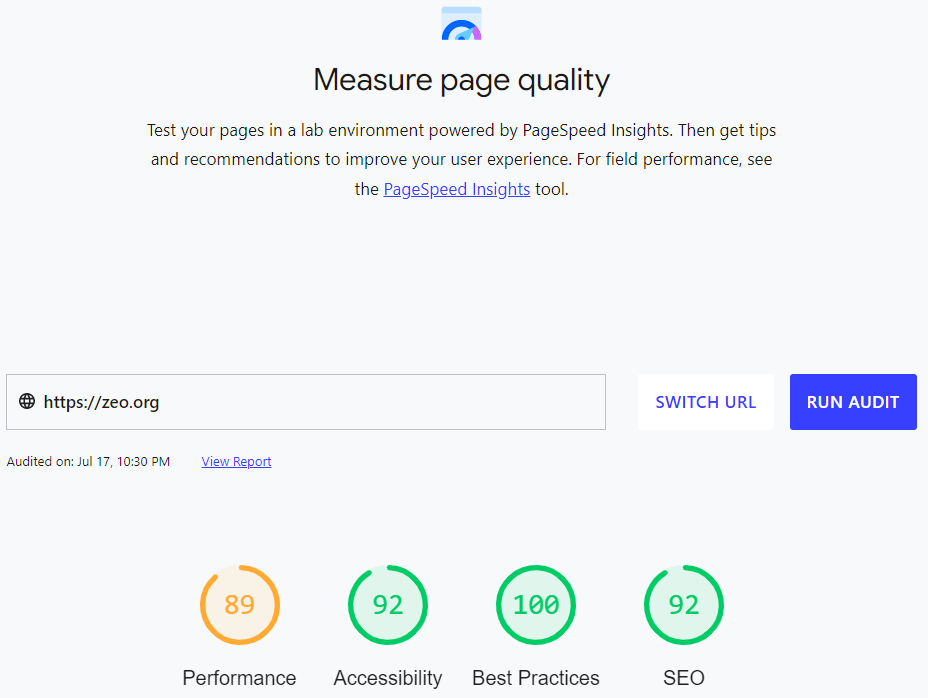
Lighthouse
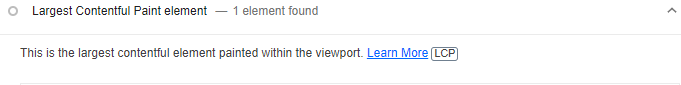
It's an ideal tool for running tests and testing improvements in a lab environment. It allows you to audit and evaluate your site in four areas: performance, accessibility, best practices, and SEO. Lighthouse can measure various lab user experiences metrics such as LCP, CLS, TTI, or TBT.
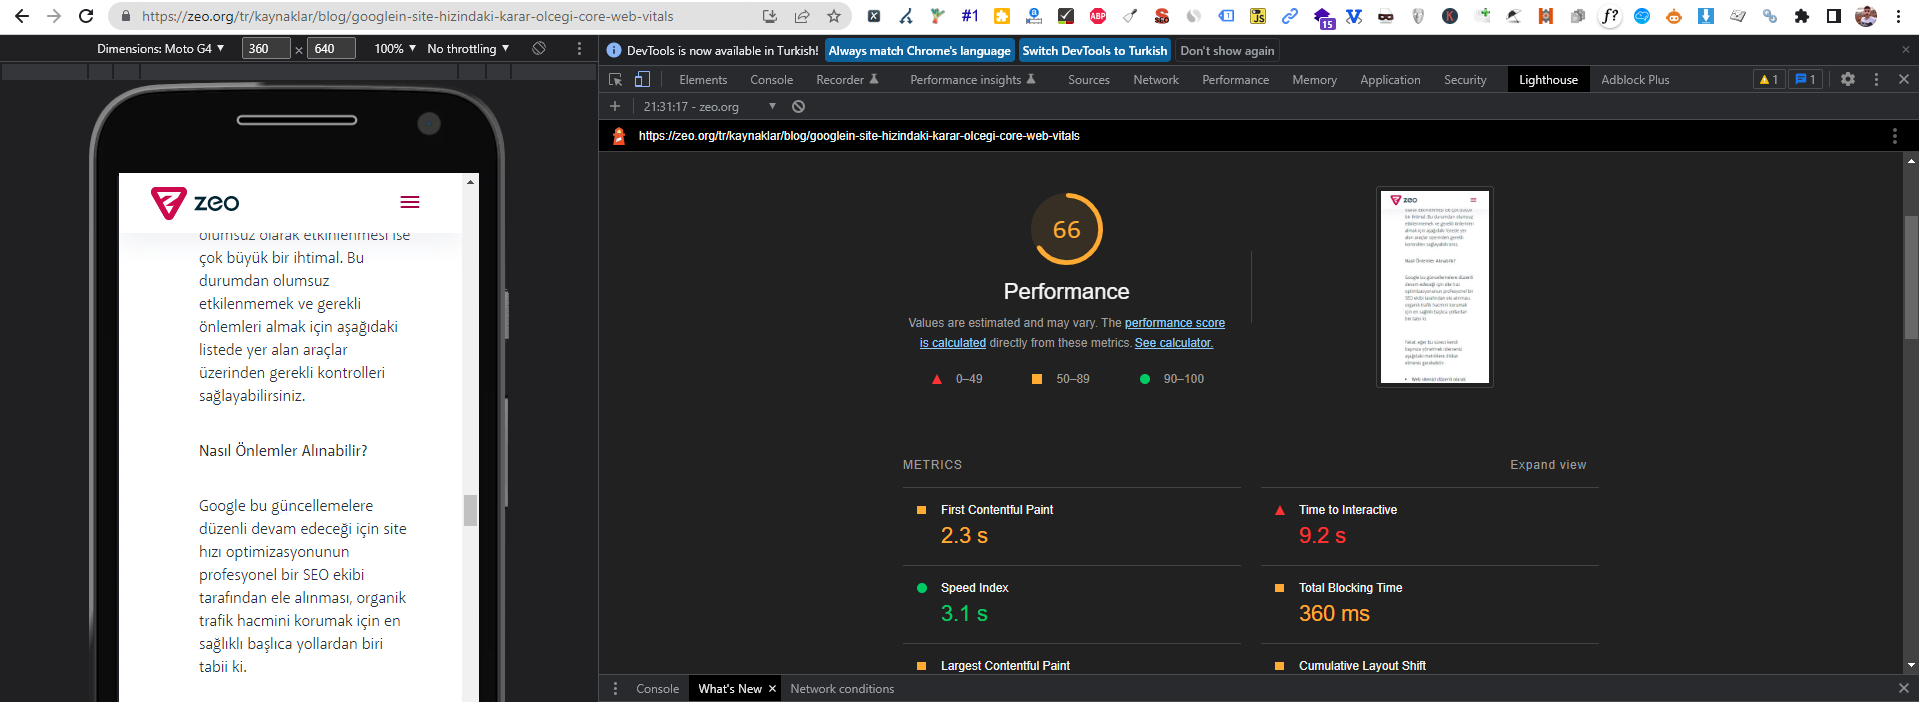
A screenshot for zeo.org
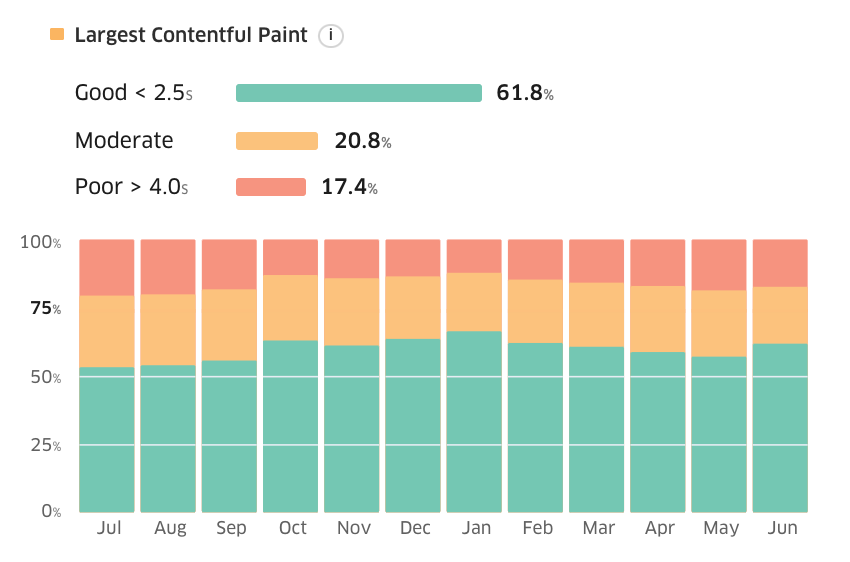
This tool, it is a very good tool to provide in-depth analysis and measure the possible effects of the work you propose by making various customizations before it is realized.
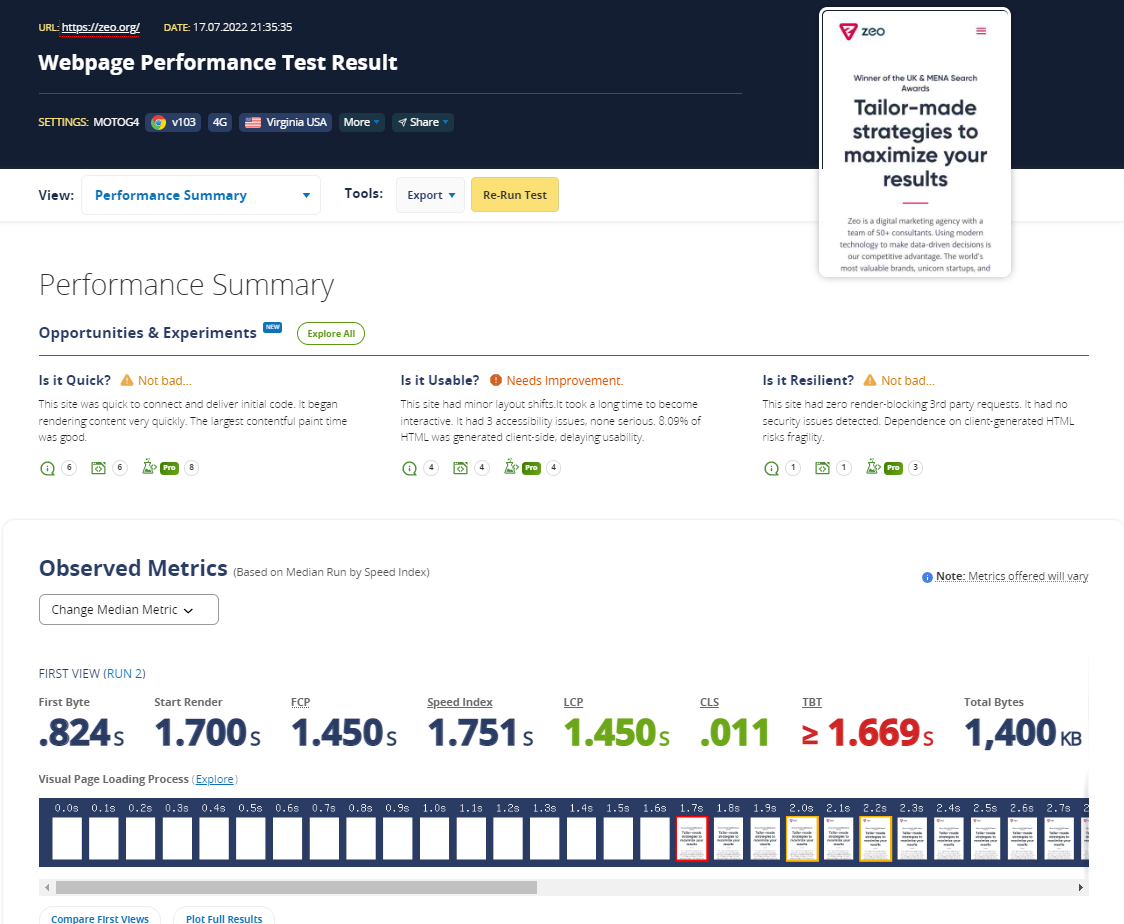
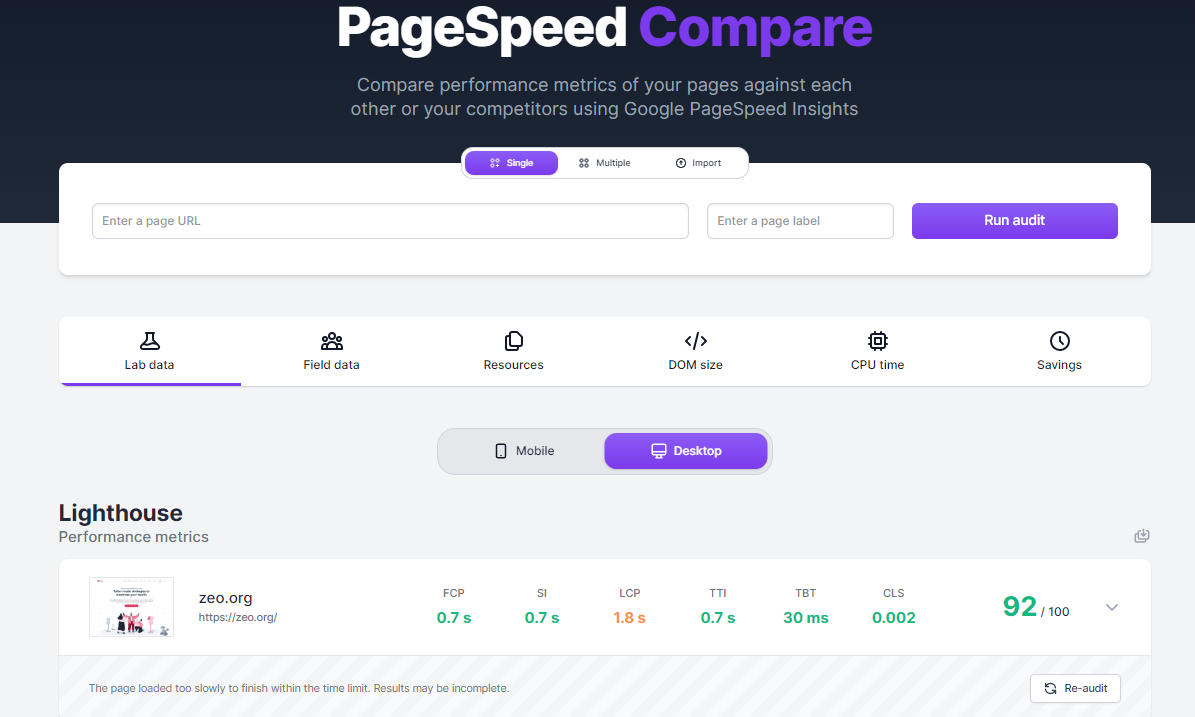
It's a tool that allows you to test multiple domains at the same time and at the same time you can examine the data graphically much more easily. I often use it especially to have an overview and I always include these graphs in my reports.
Web.dev is actually a slightly fancier and different version of the Google Lighthouse tool. The main difference is that it can store historical audits for you if you log in with a specific Google account. This can be very useful if you're in the middle of a large and extensive development, or if you're constantly making improvements to a site and want to see your progress over time.
GTmetrix is a different tool that's been around for a long time, which you can use to measure the speed and performance of your site. GTmetrix is actually based on data from Google Lighthouse and gives you a result.
TREO Site Speed
TREO Site Speed is a different and slightly more colorful tool to provide CWV auditing. It actually has a pretty good and clear user interface.
It's based on field data from the Chrome UX Report and lab data from Google Lighthouse, so we can ensure the accuracy of the data.
In fact, this tool is available as a plugin and is used in a slightly more niche topic, the CLS metric, as the name suggests, as a tool to help you visualize the Cumulative Layout Shift metric of a page by showing you exactly which elements have changed and how they have changed. But remember that it is a lab tool that provides data based on your device, browser, screen resolution, or connection type.
I have briefly explained a total of 12 tools that I use in my work. In fact, these tools help us to perform a test to see whether a particular optimization process is fundamentally beneficial.
But this measurement only gives us an idea about how a site works, and the results we get do not mean that we see the whole picture in a precise way.
So let's take a look at how we can use these tools, as well as our own SEO skills, to perform a Core Web Vitals audit.
Core Web Vitals Audit Checklist
This audit checklist contains all the possible items you should check when auditing a site for Core Web Vitals, Google Page Experience Signals, overall performance, and speed.
Some of the steps here can be completed quickly at a simple level, while the majority of them can be implemented by people with software knowledge. As an SEO Specialist or brand manager, you can consider this checklist as a set of guidelines for developers to follow under your guidance.
While I use many tools in Core Web Vitals audits depending on the current site, I mostly use Google Pagespeed Insight, Google Lighthouse, Chrome DevTools, and manual review methods. I will mostly use these methods in the items here.
Let's get started!
Largest Contentful Paint (LCP)
The Largest Contentful Paint (LCP) metric measures the loading performance of a web page. If the LCP metric for a web page is 2.5 seconds or less, you will be providing a good user experience related to LCP.
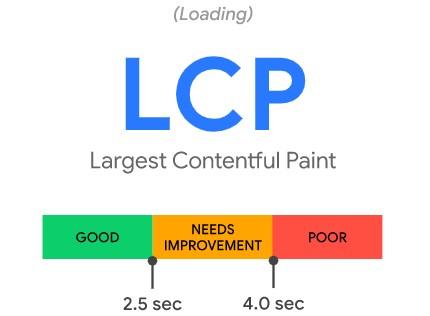
In simple terms, LCP measures and calculates how fast the main content of a web page loads. A block of text or an image is usually considered the main content.
Field Tools for Measuring the LCP Metric:
- Google PageSpeed Insights
- Google Search Console (Important Web Data report)
- Chrome User Experience Report
- web-vitals JavaScript library (recommended if you are a developer)
Laboratory Tools for Measuring the LCP Metric:
- Chrome DevTool
- Lighthouse
- WebPageTest
- Web Vitals Chrome extension
I recommend you check PageSpeed Insight and GSC Core Web Vitals reports to examine the field data while checking the LCP metric and at the same time providing optimization actions.
In addition, I think it would be useful to use Chrome DevTools, Lighthouse, and WebPageTest to check the performance of the LCP of the tested web page.
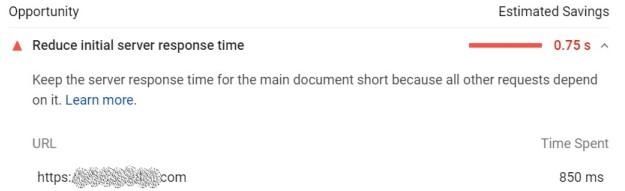
1- Check Server Performance and Whether It is Properly Optimized
A server that is not optimized or overloaded will be at a disadvantage in terms of speed.
Poor server performance can increase the time it takes for a web page to download on the browser side.
Slow server time almost always has a direct negative impact on the LCP score.
How to Check
First of all, test your web page with the Google Pagespeed Insight tool. This tool will clearly show you if there is a problem with server performance. If there is a problem with server performance, you will see a warning below.
Optimization Steps to Take
- First of all, I recommend that you contact the hosting provider and ensure server optimizations or get support from the hosting company in this regard. With this, you can switch to a higher-level server.
- However, another step that can help you improve server performance is to check your PHP version and upgrade it to the latest version.
- Apart from these, Google has provided an in-depth resource on Server Performance Optimization. You can take server performance one step further by following the steps here.
- Apart from all these, if you cannot make enough progress with the server, you can minimize the site load by providing more work for other items for a site load suitable for your server. Follow the steps for this.
2- Check If You Are Using CDN (Content Delivery Network)
CDN, Content Delivery Network, is referred to as Content Delivery Network in our language.
CDN allows users who want to access your website to access it through these servers by directing them to the servers located geographically closest to them.
In this respect, a website using CDN has the chance to load faster than other sites. Due to the opportunity to use location-based servers, they do not have to wait for network requests to remote servers.
Optimization Steps to Take
- First, test whether the website uses a CDN. You can use the CDN Finder tool for this.
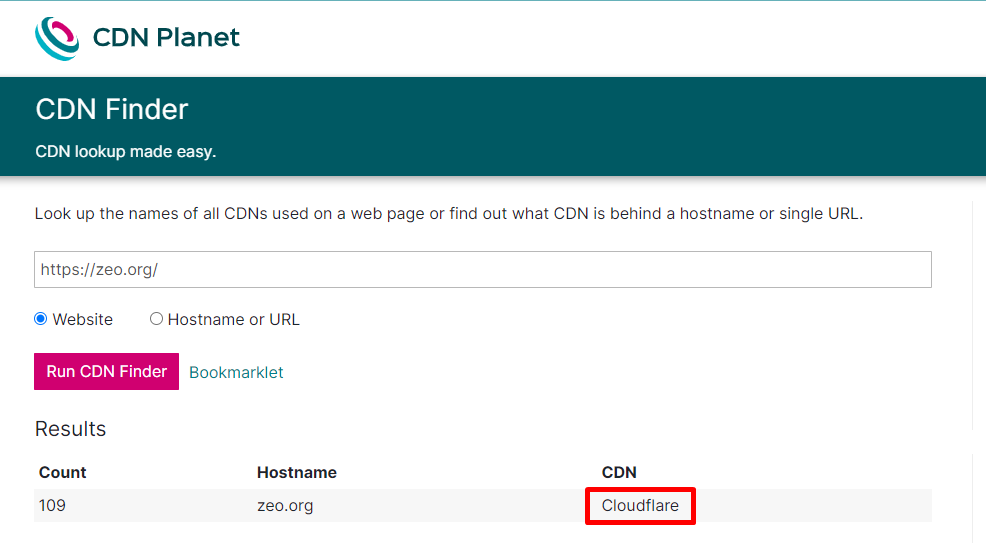
Test result for zeo.org - If you are not using a CDN, you can use one of the many CDN providers available. My recommendation for you would be Cloudflare, which is the most preferred CDN provider.
3- Check if the Cache Method for Static Entities is Used Correctly
Caching a website, especially static assets, is one of the most important elements that directly affect the LCP metric.
You should use caching for assets on your website that you don't have to change frequently or on every request. This will significantly improve the TTFB metric and optimize resource usage.
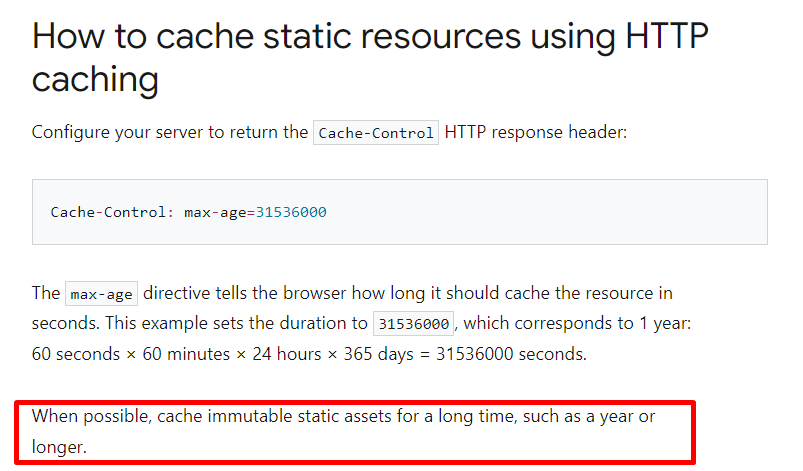
Thanks to this optimization work, when the browser sends a request, the server can tell the browser how long it should temporarily store or cache the resource. For any subsequent request for that resource, the browser uses its local copy instead of fetching it from the network.
Google recommends caching immutable static assets for a long period of time, such as a year or more.
How Do I Check?
- Use the Google PageSpeed Insights tool to check if website assets are cached. The tool will show a list of resources that are not cached or not using an efficient cache policy.
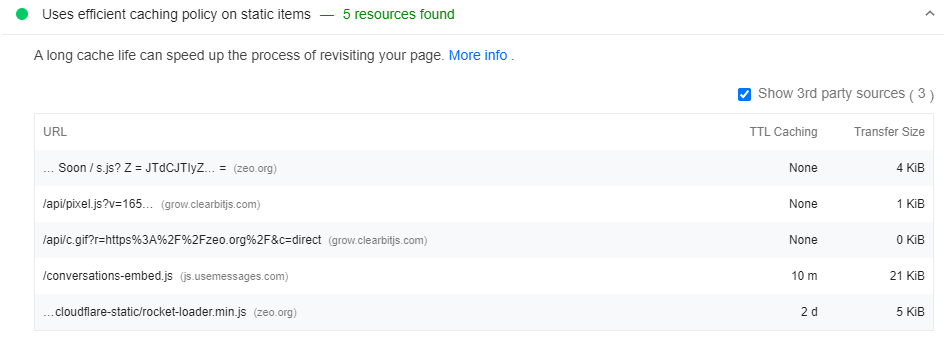
Outside of PSI, you can use Chrome Dev Tools to quickly see which resources are cached and how, and take the necessary steps accordingly.
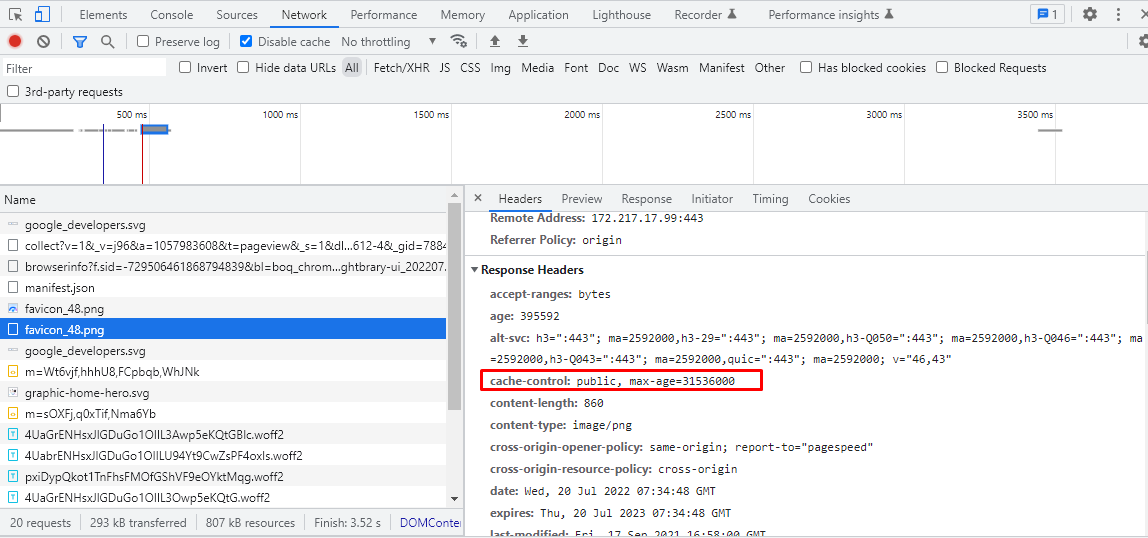
In Chrome DevTools, open the Network tab to see what resources the browser is caching:
- Press 'Control+Shift+J' (or 'Command+Option+J' on Mac) to open DevTools.
- Click on the Network tab.
In Chrome Dev Tools, the Size column can help you verify that a resource is cached.
Check the HTTP header data to verify that the Cache-Control header of a resource is set as expected:
- Click the URL of the request under the Name column of the Requests table.
- Click the Headers tab.
After the determinations you have made, it is up to you how long you will determine for which files in the caching process for your site.
After the decision you have made, the steps below can benefit you:
- We recommend implementing server caching. There are many different ways to do this:
- Configure your own cloud provider, for example, Azure or AWS, to cache static assets.
- Use a CDN and configure the relevant settings there.
- Apart from all this, there are many sources for detailed information on how the browser caches different resources or how to customize it. To learn more about caching resources in HTTP cache, you can check out these resources: your first line of defense guide and the code lab on configuring HTTP caching behavior.
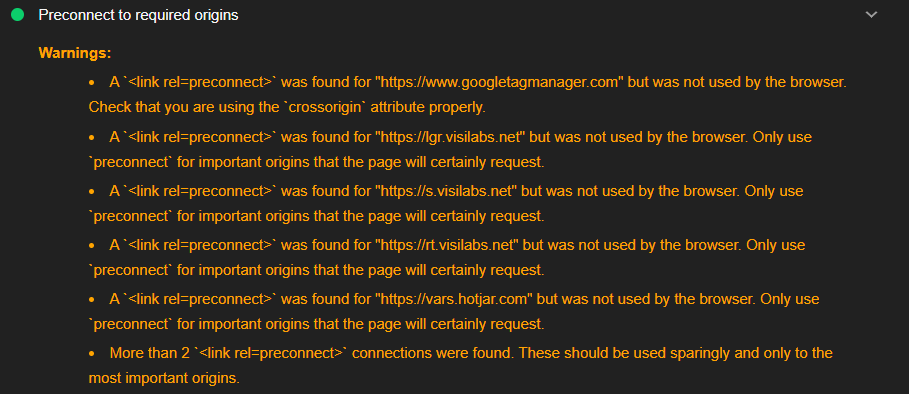
4- Use Early Connection Establishment Commands to Third-Party Connections
The sooner the connection to the various Third-party tools on our site is established, the better for LCP.
Two commands can be used for this optimization process, rel="preconnect" and rel="dns-prefetch" and the command we recommend here is preconnect.
How Do I Check?
- Use the PSI or Lighthouse tool to test if the preconnect command is being used.
- If one of these commands is used, the tool will indicate this as a successful check. If one of the above commands is not being used, the tool will present this as an opportunity.
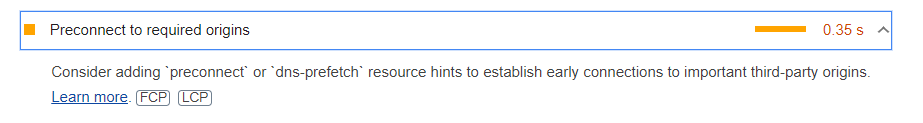
The Tool Presents as an Opportunity.
Here, the Tool Audit is Characterized as Successful.
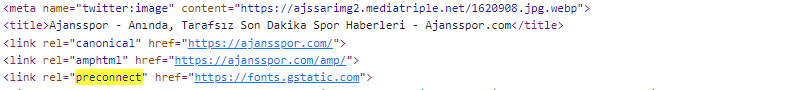
Optimization Steps to be taken:
The sample code structure is given below.
<link rel="preconnect"href="https://example.com">
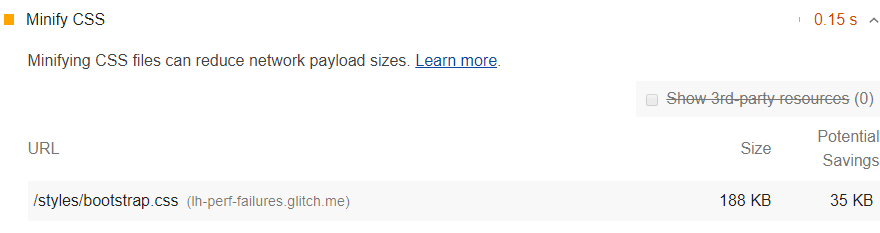
5- CSS Küçültme İşlemini Kontrol Edin
Style and scripts are the issues that can negatively affect both the FID (first entry delay metric) and the LCP metric.
For this reason, one of the most important stages of site speed improvements is minimizing CSS files.
How Do I Check?
- To check if your CSS file is compressed, PSI will give you the right result. The tool will show you if the CSS is minified or not. In addition, other site speed testing tools will also give you the right result in this regard.
Optimization Steps to Take:
There are many ways to minify CSS, depending on how this site was built and what technology it uses.
- To compress your CSS file, clean it of all comment lines, unnecessary spaces, and indents.
- You can also use CSS compression plugins for optimization.
- Minification basically means removing unnecessary lines without affecting how the source is rendered by the browser.
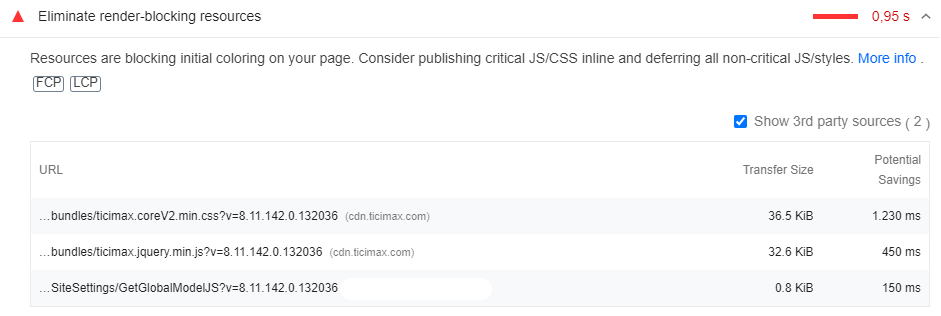
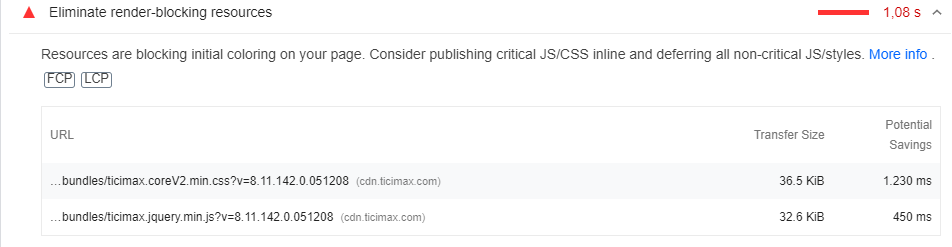
6- Reduce Unused JS and CSS
Unused JS and CSS files for your web page should be reduced, as they can have a big impact on the LCP metric and are also a render-blocking resource.
How Do I Check?
- You can access unused CSS and JS files from the Scope section in Chrome DevTools or via PSI.
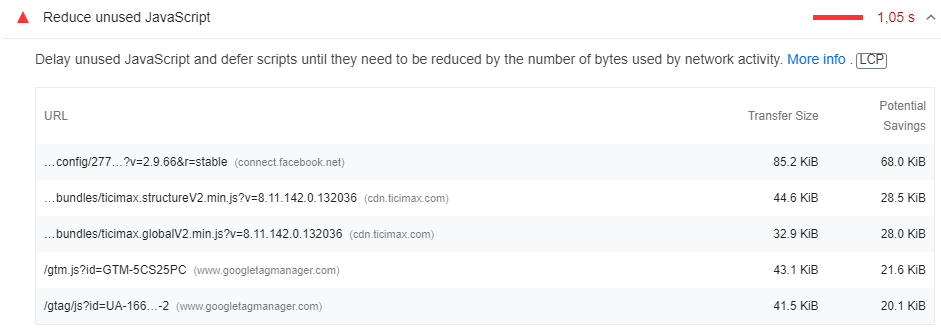
Optimization Steps to Take:
Tips on removing unused CSS provided by PSI when a site contains unused CSS.
- Basically, you just need to clean up the unused CSS and Javascript resources.
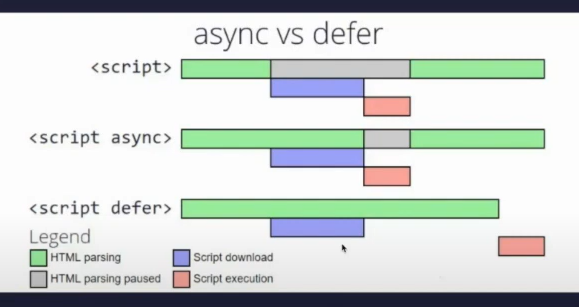
- In addition to this, you can provide a secondary optimization by delaying the loading of the relevant resources with the defer or async command and ensuring that the resources you deem important are loaded earlier.
To give an example;
Considering that these JS files have no design impact, delayed loading will contribute to solving the problem created by TTBT and other metrics.
Here, the elements that will not cause design problems should be loaded by delaying using the defer element.
The sample structure you need to reference is below.
<script defer src="https://www.google-analytics.com/analytics.js"></script>
If you foresee a problem on the measurement side here, the async tag can be used instead of the defer tag.
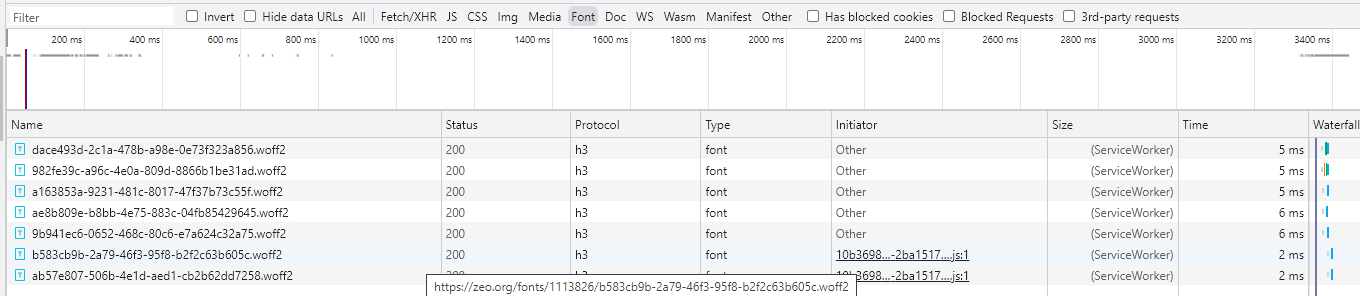
7- Use WOFF2 Fonts
Font file formats have a big impact on the LCP side, as they delay rendering when browsers load font files late.
The WOFF 2.0 font format improves font compression by 24% on average.
How Do I Check?
Use the Chrome DevTools tool for this check. You can perform the check by examining the Font section under the Network tab.
Optimization Steps to be taken:
- Use the WOFF 2.0 font file format for better font compression.
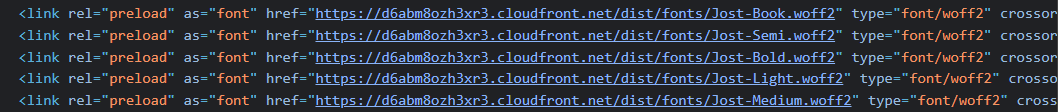
8- Apply Preload Command for Font Files
If your site is uploading font files from a third-party source, apply preload commands here to pre-link and prioritize loading.
Preload is a command that can improve the loading performance of the font file. We recommend the use of preload to optimize DNS Resolution and TCP Slow Start, TLS time for font files.
Optimization Steps to be taken
Manually, the code snippets related to the font file in the source code are examined and the code snippet in the example below can be used.
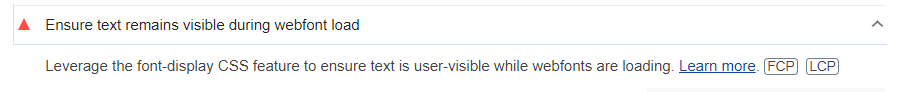
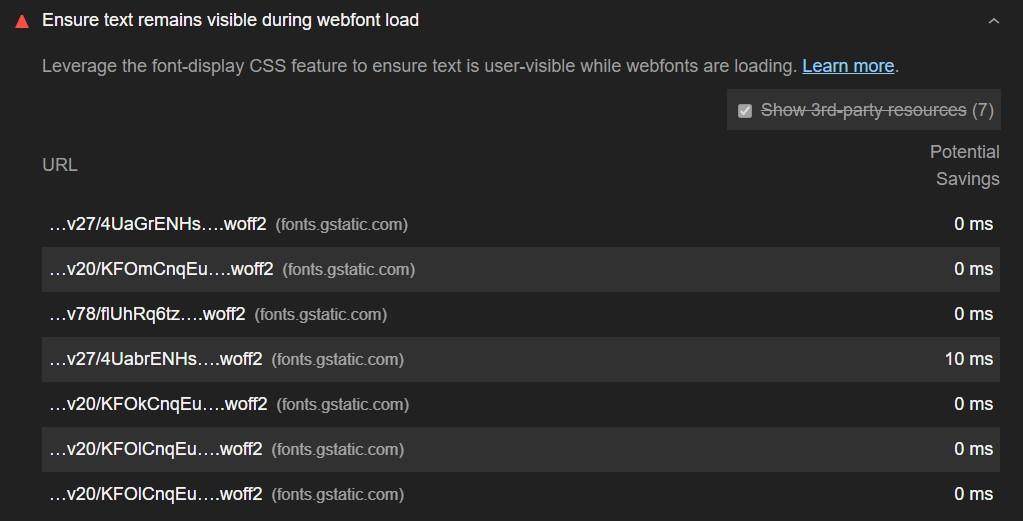
9- Don't Use Too Many Font Files and Set a Font File Display Strategy
If you haven't set a font file display strategy for your site, most browsers will block the text from appearing until your font file is loaded, causing problems on the CLS side as well as the LCP.
How Do I Check?
You can check this with Google Pagespeed Insight or Google Lighthouse tool.
Optimization Steps to Take
- In most cases, font-display: optional can do a good job.
In addition, the fewer font files you use, the easier it will be to optimize your site speed and CWV metrics.
10- Provide Critical CSS Control
Since CSS files are often a rendering-blocking resource, large CSS files can significantly slow down the rendering of a page.
You can avoid this by inlining important style files.
How Do I Check?
- You can use PSI, Lighthouse, or other tools to test whether critical CSS is inlined.
Optimization Steps to Take
If the Critical CSS is not inline in the test results, suggest one of the following:
- Extract the critical CSS using the Critical plugin or Lighthouse suggestions and add it to the <head> tag
- To be able to use this process, suggest to your developer to make use of these libraries including
- Critical , CriticalCSS or Penthouse
- In the case of WordPress websites, you can use one of the many optimization plugins.
11- Check If Your JavaScript File Needs Compression
You can improve LCP performance by minimizing the size of your JS files.
The fewer javascript files a web page can present to users, the more benefits it offers. The reason for minimizing JavaScript is to remove any whitespace or unnecessary code to create a lighter but still valid JS file.
How Do I Check?
- The Google PageSpeed Insights tool will show you if JavaScript files are minified on the web page.
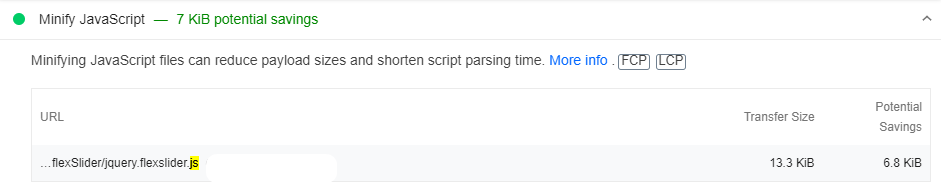
Optimization Steps to Take
- You can use a popular JS compression tool called Terser.
- You can clean up unnecessary comment lines and whitespace as you would in a CSS file.
- You can use Javascript cleanup plugins.
- Webpack v4 or higher has a plugin that minifies files for this library by default.
Note: This process for the Javascript file will have the same advantages as CSS compression.
12- Ensure Polyfills Optimization
Minimizing unused Polyfills commands and optimizing their use to be used only where necessary can significantly improve page load metrics such as LCP.
Modern browsers should not have to download passed code or Polyfills unless necessary.
How to Check
You can use Lighthouse or Google Pagespeed Insight to check this.
Optimization Steps to Take
- You can use a relay like Babel.
- To improve performance, you need to deliver modern code to modern browsers. The tricky part is that some new features of modern Javascript are not supported by older browsers. That's why you need a transpiler like Babel - it converts modern syntax that doesn't work in some browsers into the closest equivalent syntax.
- You can use <script type="module"> to prevent the relayed code from being sent to browsers that don't need it.
- It is a developer's job to analyze the site and decide whether and how to optimize Polyfills.
Note: You need Pollyfills to push newer code to older browsers. You don't want code you won't use anyway, so you should make sure this process is optimized.
13- Optimize Images
The time it takes to load resources from many types affects the LCP score for the web page.
Source files that affect the LCP metric include <img>, <video>, <image>, <svg>, and url() with a background image.
You should know that the most profitable way to improve load times is to optimize image files.
How Will I Check?
- Google PageSpeed Insights veya Lighthouse optimize edilmesi gereken herhangi bir kaynak olup olmadığını bizlere verecektir. These tools will also provide you with various optimization suggestions.
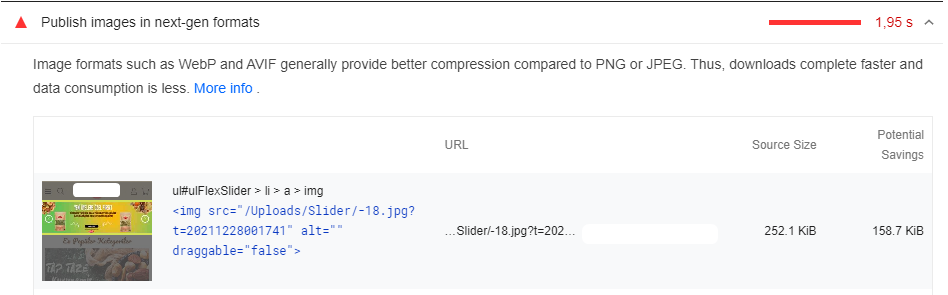
Optimization Steps to Take
Here are some of the ways to improve the loading and rendering times of images:
- You should avoid using an image as the main piece of content.
- Compress images and optimize their size.
- Use responsive images.
- Convert images to new formats such as JPEG 2000, JPEG XR, or WebP).
Google uses a file format technology called WEBP to compress JPG and PNG images on web pages in high quality, resulting in significant reductions in image size.
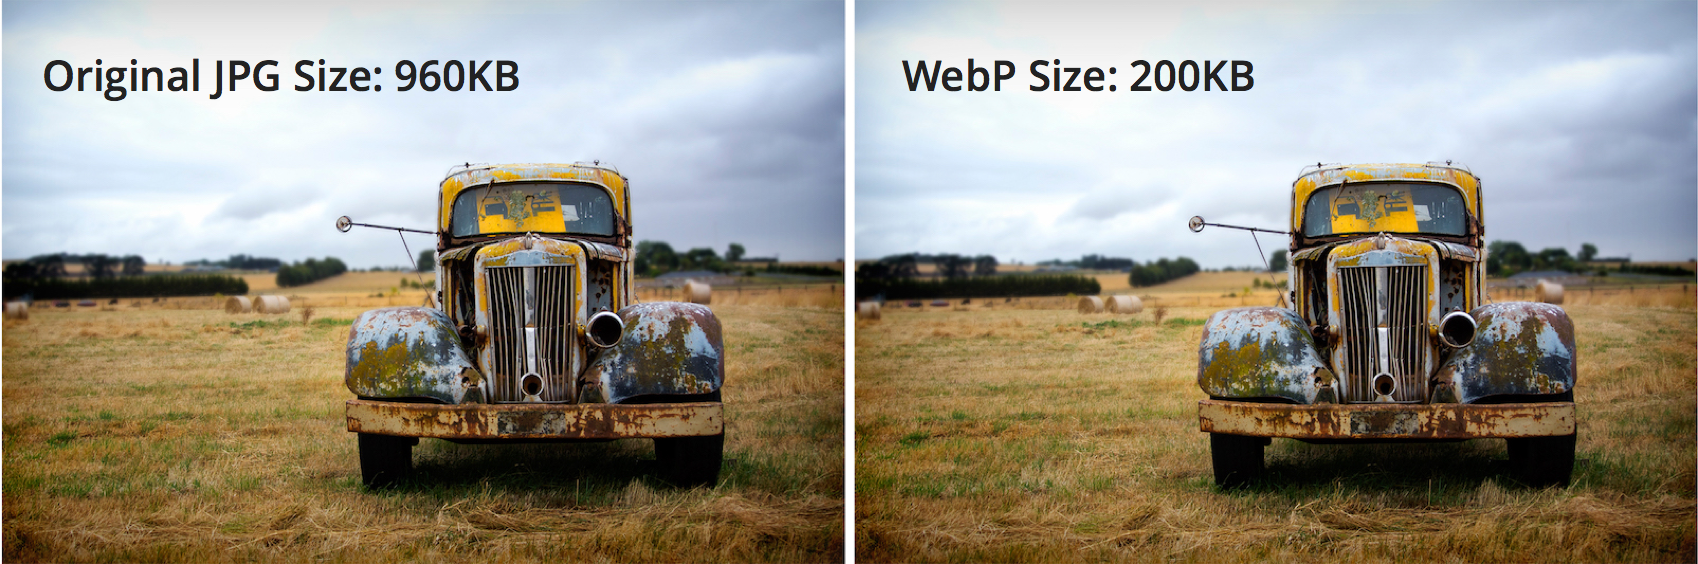
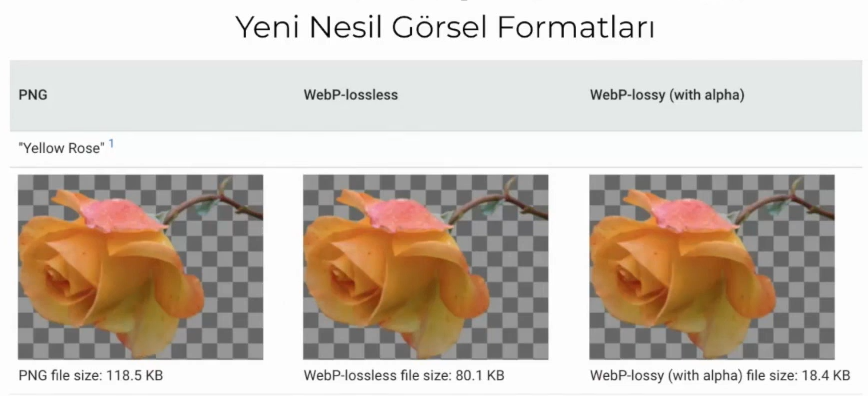
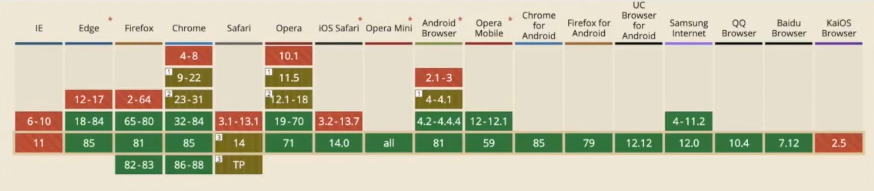
There are some things to be aware of when using the webp format. Today, not all browsers have yet completed the process of compatibility with the new generation of image formats.
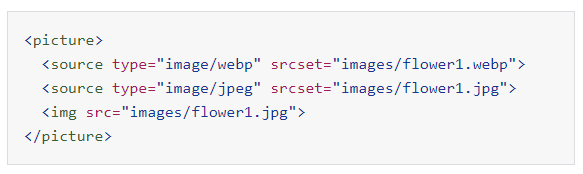
At the same time, in order for all images on the website to be loaded responsively according to device type and size, they must be organized using Picture/source tags as in the code block below.
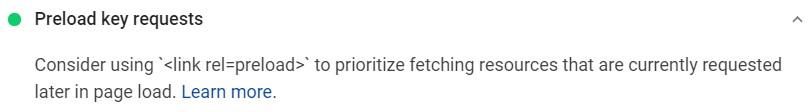
14- Pre-load Important Resources
Pre-loading important resources, in fact, what users and search engine bots consider important resources, has a direct impact on the LCP score.
Preloading the resources that will be needed as soon as the user loads the page, the ones above the fold, can have an excellent effect. To do this, you can add a <link rel="preload"> in the <head>.
How do I Check?
- Test the web page with the Google PageSpeed Insights tool, which will let you know if this command is included for important resources.
Optimization Steps to Take
To do this, you can add a <link rel="preload"> in <head>.
You only need to preload critical resources.
15- Compress Text Files
Just like CSS and JS files, compressing resources and text files can significantly improve the load times of a web page and thus have a positive impact on the LCP score.
How to Check?
- Use the Google PageSpeed Insights tool or the Lighthouse tool to check if text compression is enabled on the site. Many hosting providers actively offer this feature.
Optimization Steps to Take
- If text compression is not enabled for your site, we recommend optimizing with Gzip or Brotli.
- Gzip compression is supported by all browsers but provides less performance than Brotli, which is supported by almost all new browsers.
16- Review the Adaptive Serving Option
For your website, conditionally serving assets on your page based on the type of internet connection users have or based on the device can significantly improve load times and therefore LCP.
How Do I Check?
You need to check manually with Chrome Dev Tools.
Optimization Steps to Take
If the site you are auditing is not using Adaptive Serving and has very large assets that can be conditionally served
you can suggest one of the following APIs:
For example, if the Internet connection is slower than 4G, you can suggest displaying images instead of videos.
if (navigator.connection && navigator.connection.effectiveType) {if (navigator.connection.effectiveType === '4g') {
// Load video
} else {
// Load image
}
}
This method is a slightly more advanced and advanced technique. For this reason, you can find more detailed information on this subject from this source.
17- Check the Availability of Server Side Rendering or Dynamic Processing
Using server-side rendering or dynamic processing can also help improve the LCP metric.
Key Steps to Take:
- Use server-side rendering or opt for dynamic processing
- If this is not possible, optimize your client-side rendering with a Prerender-style tool.
As Google has long noted, JavaScript is currently very difficult to render and not all search engine crawlers can render it quickly. One of the most effective solutions is dynamic rendering - requests from real users are served normally, while bots and crawlers are served the version of the content that works best for them.
If you can't implement dynamic rendering for your website, the next best thing you can do for SEO is server-side rendering. If that's not possible either, make sure to use pre-processing.
As you can see, we actually need to do a lot of optimization just to improve the LCP metric. Next, we have the other two metrics.
First Input Delay (FID)
FID, or First Entry Latency, measures the interactivity of a web page. To have a good FID performance, your web pages should have an FID performance equal to or less than 100 ms. This will also provide a good user experience.
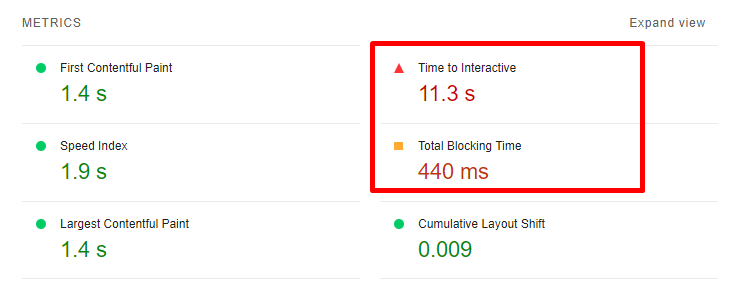
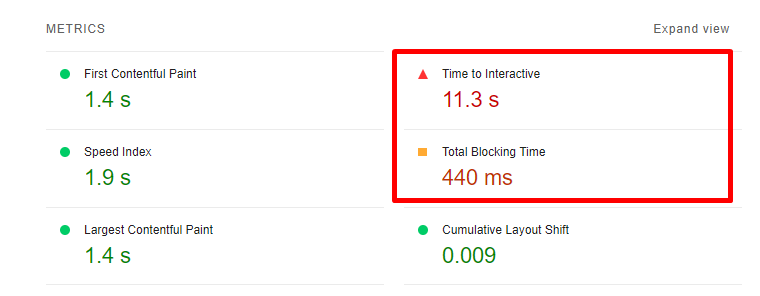
FID, or First Login Delay, cannot be measured in the lab because it requires a real user login. Total Blocking Time (TBT) is the metric that is closest to and related to FID and can be measured in the lab.
Time to Interactive (TTI) metric can also be used as a laboratory indicator for FID.
Javascript, a topic you can see in every metric, also appears here. A clunky JavaScript execution process is often the root cause of degraded FID performance.
Therefore, to ensure successful FID optimization, we need to optimize Javascript in the best way possible.
Note: Google recently introduced a new experimental metric, Interaction to Next Paint (INP), which could replace FID.
What is Interaction to Next Paint (INP)?
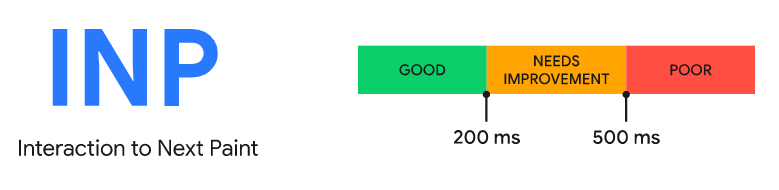
INP aims to represent the overall responsiveness of a page by measuring all click, tap and keyboard interactions with a page.
Where INP takes into account all page interactions, First Input Delay (FID) only takes into account the first interaction. It also measures only the input latency of the first interaction, not the time required to run event handlers or the delay in serving the next frame.
INP is more than first impressions. By sampling all interactions, responsiveness can be assessed comprehensively, making INP a more reliable indicator of overall responsiveness than FID.
What Tools Can We Use to Measure FID?
- Google PageSpeed Insights
- Google Search Console Core Web Vitals Report
- Chrome User Experience Report
- Google Lighthouse
- web-vitals JavaScript library
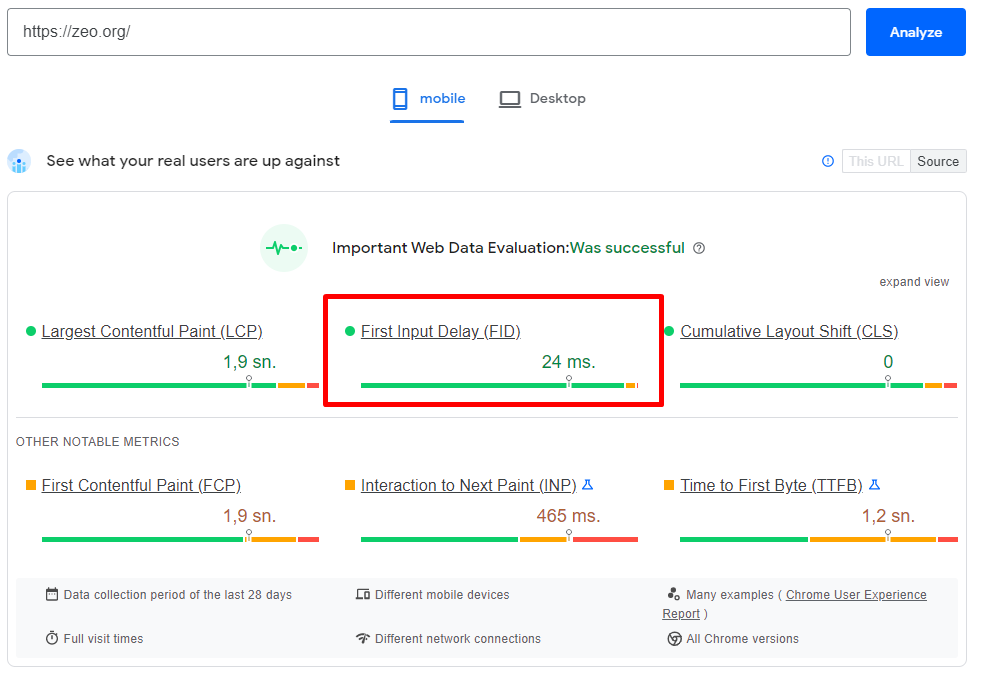
For the purposes of this audit, I recommend using Google Pagespeed Insight or Google Lighthouse to examine the FID metric. Note that FID can only be measured based on field data.
However, we recommend using lab tools such as Chrome DevTools, Lighthouse, GTmetrix, GTmetrix, and WebPageTest to measure metrics such as TTI and TTB, which are related to FID, and to work on improvements accordingly.
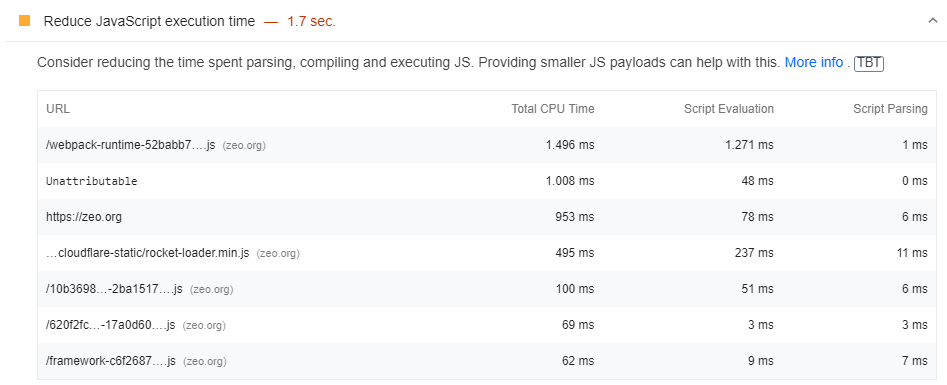
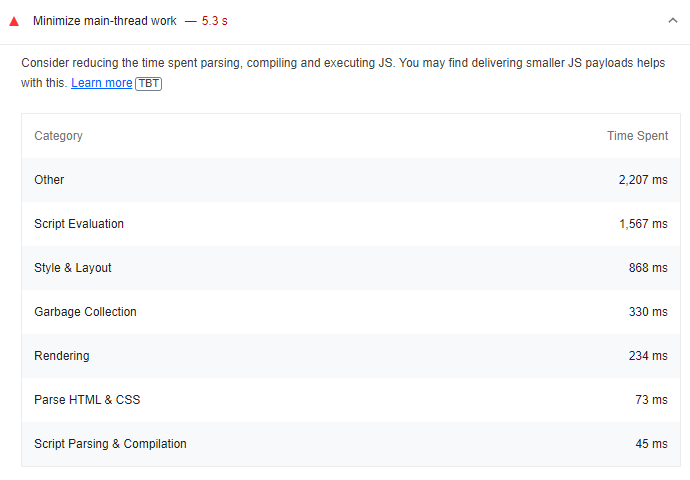
18- Minimize Long Javascript Tasks
Improvements in Javascript are important for FID. You can improve this metric by breaking long Javascript tasks into smaller, asynchronous tasks.
The definition of a long task is a piece of js code that blocks the main thread for 50 ms or more.
Nasıl Kontrol Edeceğim?
- You can use the Google PageSpeed Insights tool for this optimization audit.
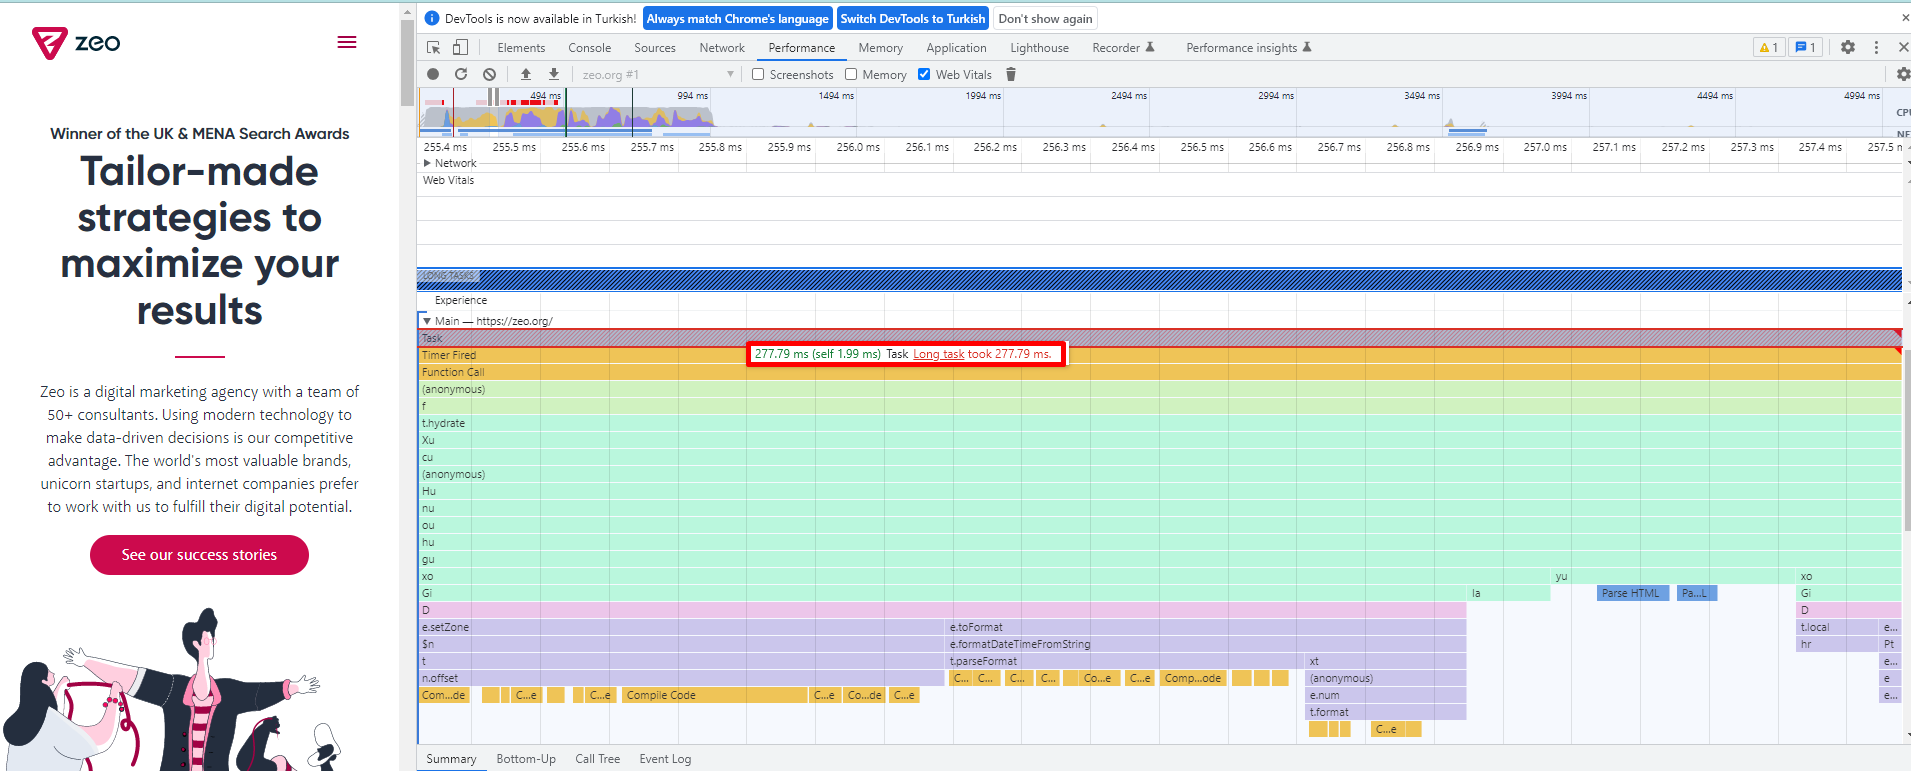
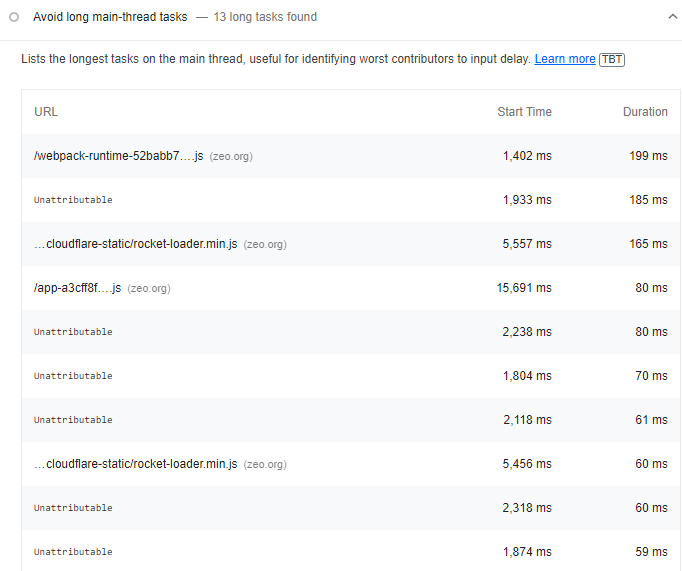
- Apart from PSI, you can test long tasks using Chrome DevTools. What you need to do is very simple; you can easily do it through the Performance Dashboard, which is to keep track of the web page load.
- You can also use Lighthouse to check if there are long missions.
Atılması Gereken Optimizasyon Adımları
- Bu uzun görevleri yukarıda anlattığımız yöntemlerle analiz edin ve geliştiricinize bunların 50 ms altında çalışan küçük görevlere bölünmesi gerektiğini açıklayan önerinizi iletin.
- Bu parçaları doğru yerde ve zamanda çalıştırın.
- requestIdleCallback API'sini kullanabilirsiniz .
- Konuyla alakalı daha detaylı bilgi için Uzun JavaScript görevleri Etkileşim Zamanınızı geciktiriyor mu? Makalesini inceleyin.
19- Analyze the Impact of First Party Scripts
Inefficient script execution negatively impacts website interactivity and the FID, TBT, and TTI metrics.
The main cause of delays during interaction preparation is mainly unnecessary JS load, cumbersome JS execution, and large script executions.
How do I check?
- Test your page with Google Pagespeed Insight or Google Lighthouse.
The metrics to be tested include FID, TBT and TTI. You can also analyze these metrics using Chrome DevTools.
Optimization Steps to Take
You should offer the following suggestions to your developer.
- Progressive loading of code.
- Server-side rendering or pre-rendering depends on the type of website and application.
- Remove non-essential scripts from the critical build path.
20- Reduce the Impact of Third Party Code
Third-party scripts such as advertising tools like Adsense, analytics tools, pixels, or social media buttons negatively affect page speed. For this reason, when using third-party scripts, you should make sure that you are using scripts that are really quite necessary or that you are installing them correctly.
Third-party script execution (especially if it is heavy) can have a negative impact on the site's interaction latency.
Fortunately, there are a few optimization moves in this case, such as optional loading.
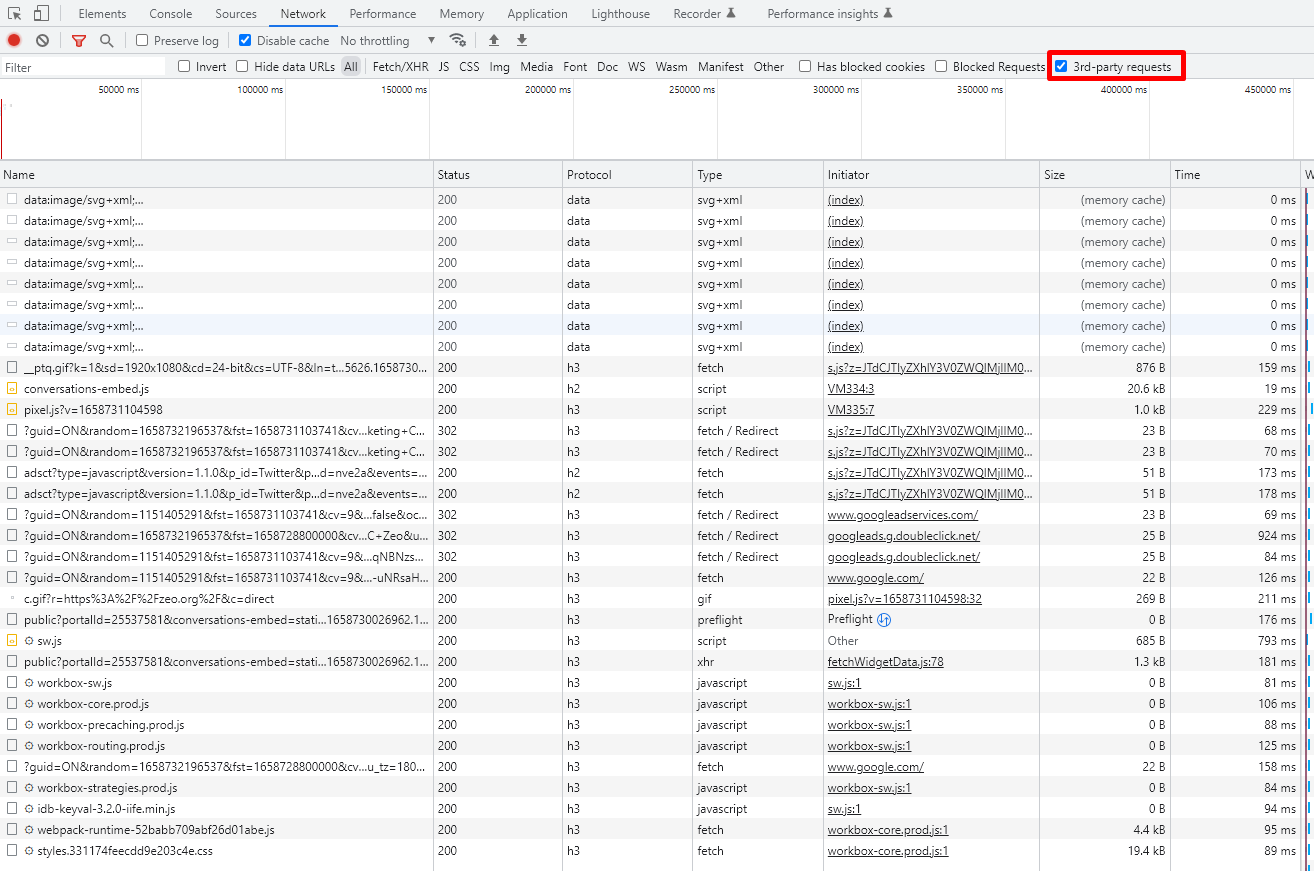
How Do I Check?
- Test the website with Google PageSpeed Insights to check if these files negatively affect metrics such as FID, TTB and TTI.
- Also, use Lighthouse to test whether the site contains third-party analytics and tags that affect engagement latency.
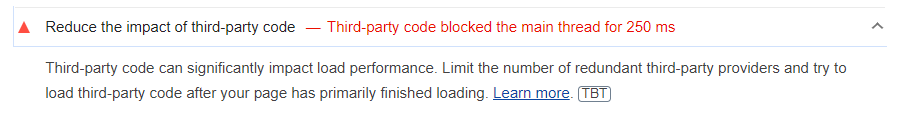
- Apart from all this, if there are prioritisation or bandwidth issues in the main thread, check if there is any optimization for prioritized scripts and other third-party scripts. You can check this in Chrome DevTools under Network.
Optimization Steps to Take
- Use third-party tools on a limited basis.
- Upload third-party code after the prioritized areas of your page has finished loading. For example, this could be code from tools like Google Analytics or Linkedin.
You can use the Defer or Async command to ensure this.
Note: Work with your developer to decide which scripts to load earlier or later.
21- Use a Web Worker to Optimize Main Thread Blocking (Comlink, Workway, Workerize).
Thanks to web workers like Comlink, Workway, and Workerize, Javascript can be run in a background thread which has the power to reduce the blocking time of the main thread and at the same time positively impact the FID metric.
How Do I Check?
- You can use Google PageSpeed Insights, Lighthouse and Chrome DevTools for this check.
Daha fazlasını web.dev'in WebWorkers ile ilgili makalesinde okuyabilirsiniz.
Optimization Steps to Take
- Move non-UI operations to a separate worker thread to reduce main thread blocking time.
- Use libraries like Comlink.
As you can see from Comlink's own description, it is important to make the main thread as performant as possible in order to respond quickly to user interaction on mobile phones, and indeed, especially on low-end mobile phones. This is why you should choose web workers like Comlink, Workway, and Workerize for optimization work.
You can read more in web.dev's article about WebWorkers.
Cumulative Layout Shift (CLS)
Cumulative Layout Shift (CLS), the Cumulative Layout Shift metric, measures the visual stability of a website. A website will provide a good user experience if the CLS of its pages is equal to or less than 0.1.
There are many tools for measuring CLS.
As you know, Lab tools test pages in a synthetic environment. Therefore, the CLS values reported by them may differ from the real-world user experience when interacting with the site.
Field and Lab Tools for Measuring the CLS Metric
- Chrome User Experience Report
- web-vitals JavaScript library (recommended if you are a developer)
- Chrome DevTools
- Google Lighthouse
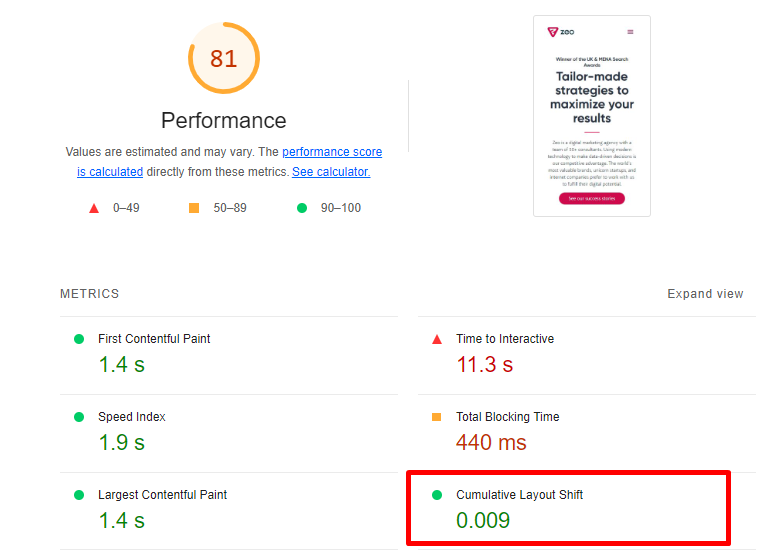
Cumulative Layout Shift Gif Maker (I think it's a very fun tool 😊)
Within these tools and for the purposes of this audit, I recommend using Google Pagespeed Insight and the Core Web Vitals report for development work related to the CLS metric.
For lab data-related metrics, use Chrome DevTools, Lighthouse, and WebPageTest. The more depth of tools you provide, the more quality work you will produce
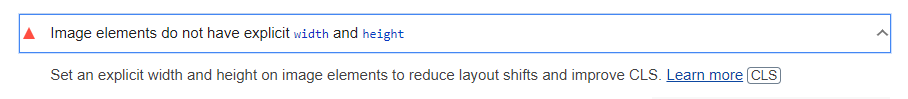
22- Add Width and Height Values for Image and Video Elements
If the browser is delayed in loading the relevant CSS file, the images may cause a layout shift in the viewport of other web page elements. This also negatively affects the "width" and "height" values and the "reflow" and "re-layout" processes that occur later.
To prevent this problem;
CLS problems can be largely prevented by entering width and height values to the images.
Adding 'width' and 'height' values to the images on the site will both solve the CLS problem and provide an extra effect on the site speed and will be suitable for the user experience.
Images and videos that do not have the specified dimensions (especially at the top of the screen) can cause layout shifts.
The rule of thumb to avoid layout shifts is to always add height and width attributes to images and videos. It is also possible to use CSS aspect ratio boxes that will allow the browser to allocate the required amount of space when loading the image or video.
How Do I Check?
- Test your site with Google Pagespeed Insight or Lighthouse
Example of image without width and height ❌:

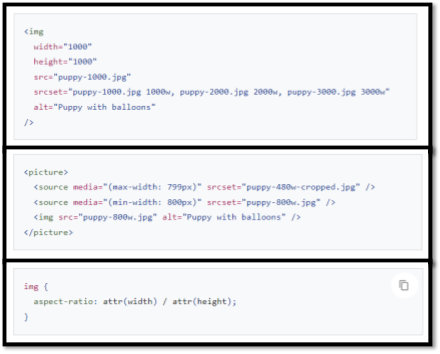
Example of image with width and height specified ✅:

Optimization Steps to Take
You can tell the browser about these dimensions using the scrset attribute so that you can serve responsive images at the correct size. You can read about best practices for doing this in this Google Developers image guide.
One thing to be aware of here is that the image quality is degraded when the height and width values you have entered are entered in different sizes.
To avoid this problem on the CLS side, elements like "srcset" or "media" are often used. The browser downloads the most appropriate image according to the viewport width and uses the "srcset" attribute and calculates the layout accordingly.
You can use the sample code blocks below for this work:
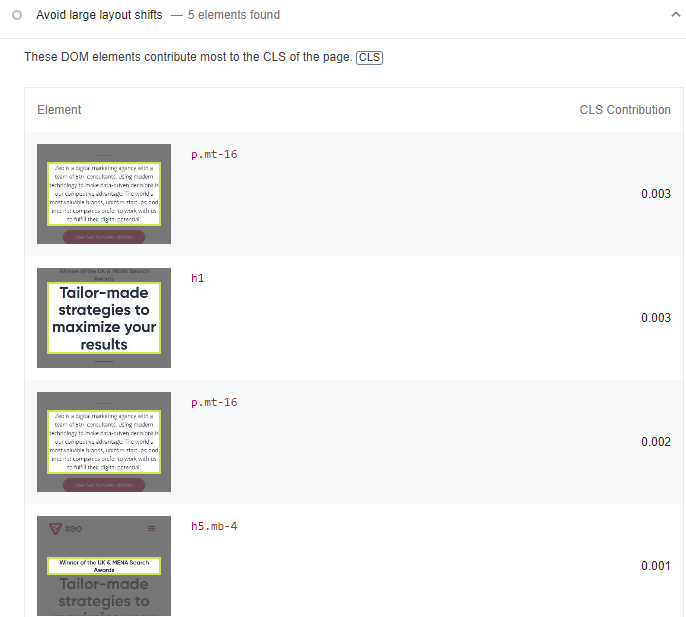
23- Have a Static Reserved Space for Dynamic Content, Iframe, and Ad Spaces
Areas such as dynamic content and ad spaces are among the most important causes of CLS problems on websites.
There are many ways in which these areas can break a page. The best way to avoid such layout shifts is to create static spaces for these areas
How Do I Check?
- To check the CLS metric, test the web page with the Google PageSpeed Insights tool.
- If possible, analyze the data provided by the GSC Core Web Vitals report.
- I also recommend analyzing the Cumulative Layout Shift score with other tools (such as Chrome DevTools, Lighthouse and WebPageTest) and using different screen resolutions.
-
Add pre-created static fields for these fields.
We actually touched on this topic a bit earlier in this article when we talked about preventing layout drift. To avoid layout shifts, the browser needs to allocate space for each piece of content that has not yet been loaded.
24- Check FOUT Status in Font Files
A FOUT condition that can occur during the process of downloading and creating font files can cause layout shifts.
A FOUT condition occurs when a backup font file on a web page is replaced with a new font file during upload.
How Do I Check and Optimize?
- The Google PageSpeed Insights tool will show if there are issues with fonts on the web page that are causing FOUT.
- To avoid this, we recommend applying font-display: optional and/or <link rel="preload"> commands.
- The best fix here is to preload the optional fonts.
25- Check FOIT Status in Font Files
FOIT is another common problem that can cause layout shifts on a web page.
This happens when invisible text occurs during the loading of font files and can cause a layout shift.
The procedures here are the same as for the previous inspection.
26- Pre-install Important Font Files
If a website does not upload font files in advance, it is quite possible to experience a layout shift. The most important way to avoid this is to upload important font files in advance
How Do I Check and Optimize?
- Test the web page with the Google PageSpeed Insights tool, which will show you if there are any problems with font rendering or downloading.
- If you decide that these are font files that can cause layout shifts, you can use the following commands:
- font-display: optional
- <link rel="preload"> For important font files
- <link rel="preload"> with font-display: optional
Example Usage:
27- Use Transform Animations Instead of Animations That Trigger Layout Shifts
Some CSS properties can trigger layout shifts that lead to poor user experience.
The simplest way to avoid this is to use transformation animations.
How Do I Check?
You can use the Chrome DevTools tool for this process. You can perform the check with the Animation option under the Performance tab in Chrome DevTools. You can also use the WebPageTest tool.
Optimization Steps to Take:
Where you can limit your animations in combination with transform animations, use
- opacity
- translate
- rotate
- scale
It is important to use transform animations instead of animations that trigger layout shifts. For more in-depth information on this topic, be sure to read this article on high-performance animations.
Yes, while providing auditing and optimization related to Core Web Vitals, providing improvements under each metric and the items I have mentioned above will allow you to bring your score to the desired level.
However, this optimization work can be a bit challenging for entry-level people and they may have difficulty fully understanding this situation with just a blog post.
For this reason, I will make a few video recommendations for you to have deep knowledge about Core Web Vitals.

Core Web Vitals: Google's New Site Speed Approach - Gokhan Ercan | Digitalzone Meetups Online
I think these two video series will be useful for you. In the continuing series of this article, I will talk about a few more niche topics and I will tell you how to perform an automatic Core Web Vitals test with Screaming Frog and how to follow this audit via Google Data Studio.


