


Site Speed Analysis with GTmetrix Guide
GTmetrix, which is an important tool for measuring site speed and checking compliance with Core Web Vitals metrics, offers us many modules to facilitate our reports. GTmetrix, where some features can also be used with a Free account, offers many more features when you upgrade to a Premium account.
Let's detail the features that you can get information about page load times, page performances, problems affecting page speed, and more below, starting from GTmetrix startup settings.
Initial Settings
When you log in to GTmetrix, you can make certain adjustments on the Dashboard screen before testing your site speed.
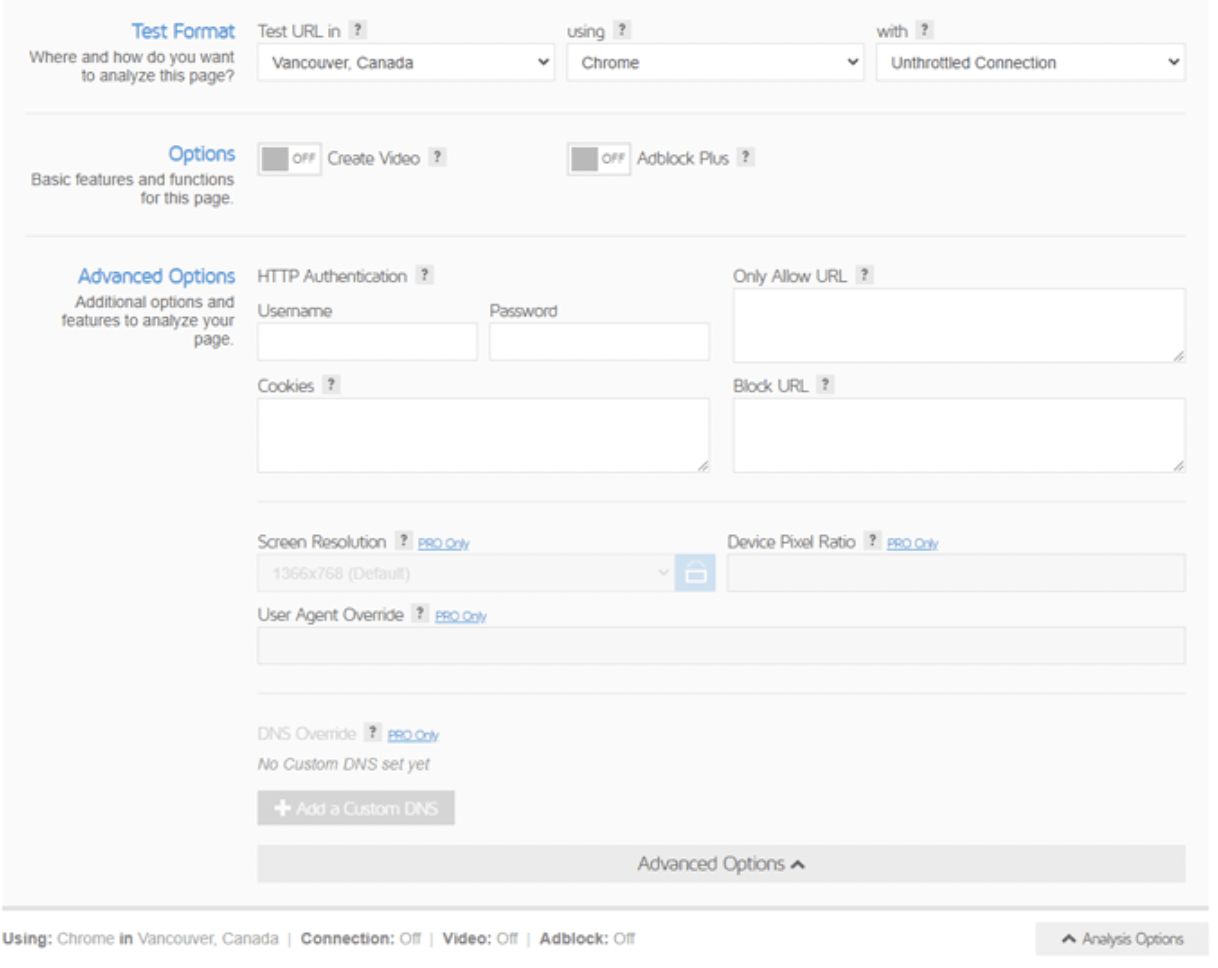
The options here can have a significant impact on the speed of the pages, so they can significantly affect the report you prepare. Let's take a look at the headings we encountered.
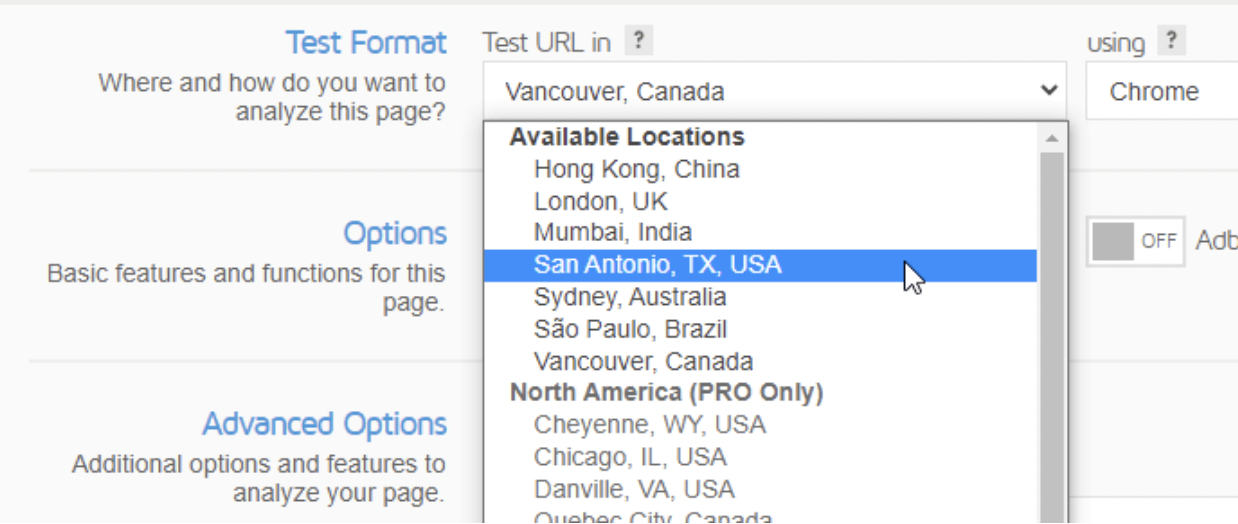
Under Test Format, you can select the location of the server where you want to test your site. The geographical distance between your server and a visitor significantly affects network latency. The farther apart they are, the longer the data has to travel. It is therefore important to choose the location correctly.
If you have a Free membership, you can choose from 7 different global regions. In Premium, you are authorized to directly select cities such as Frankfurt, Paris, and Stockholm. When choosing in this area, take care to choose the region where your users are predominantly located. You can use your Google Analytics data for this.

In Using, if you have a Free account, you can only access the desktop option with Chrome. Premium usage offers more than 30 device options and mobile testing.
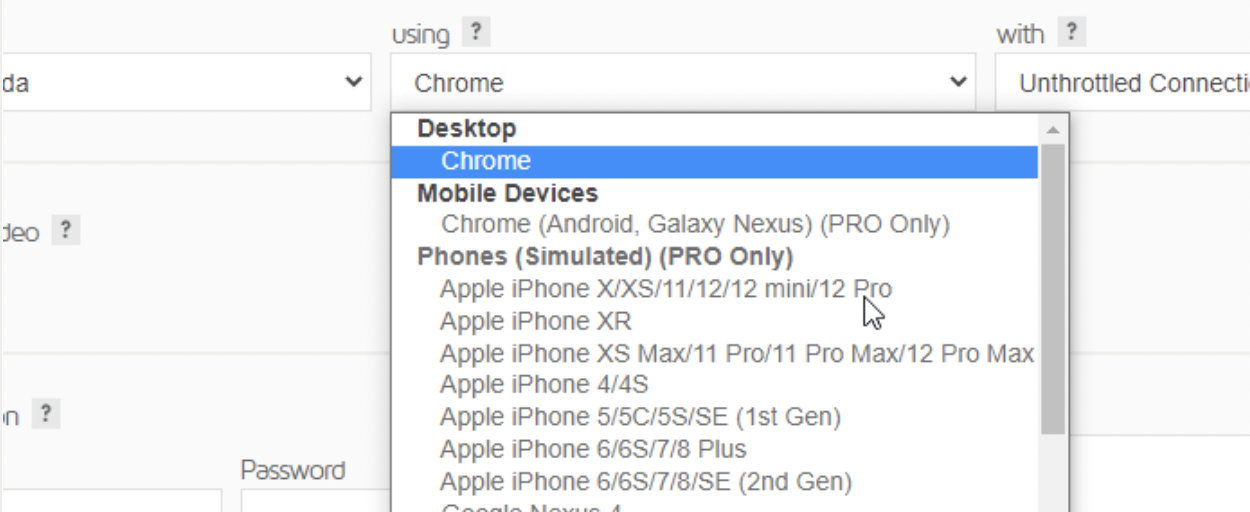
It is important to distinguish between mobile and desktop as pages may load differently on different device types. However, it is important to recognize the visitor profile and understand the performance for all situations and provide improvements accordingly. Here, it would be meaningful to determine the most preferred device type of users and analyze it. You can also use your Analytics account or Google Search Console account to find out which device your users access your site with the most.
You can choose your connection speed from the With the title, which is the last title we will examine in this area.
You can choose 8 different connection speeds, including options such as 3G, and LTE. Here again, it is important to choose the connection speed of your users and make measurements accordingly.
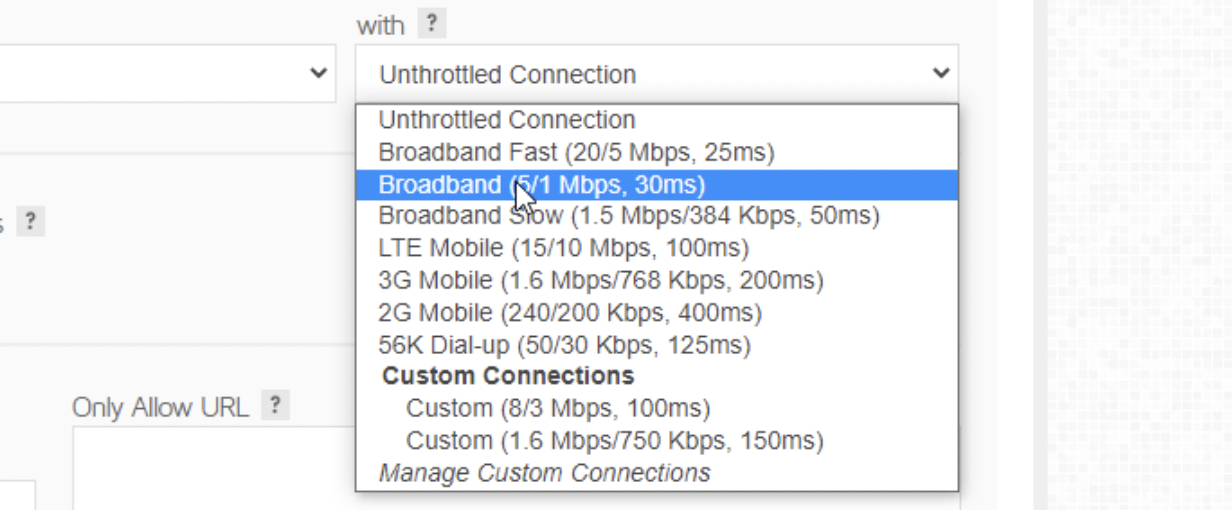
If you are a Premium user, you can perform your measurements by defining your download and upload values that best represent your visitors' thanks to the Custom Connection Speed feature.
Monitor and Set Up Alerts title; performance tracking is important in terms of being able to instantly intervene in problems that may develop on your site. In the free version, only 1 page that is important for your site is allowed to be monitored in this way.
GTmetrix Analytics
If we go into the details of the analysis after the necessary adjustments; GTmetrix bases its analysis on the Lighthouse scoring system published by Google to improve the web quality of pages. GTmetrix has its measurement data as well as Lighthouse's measurement data.
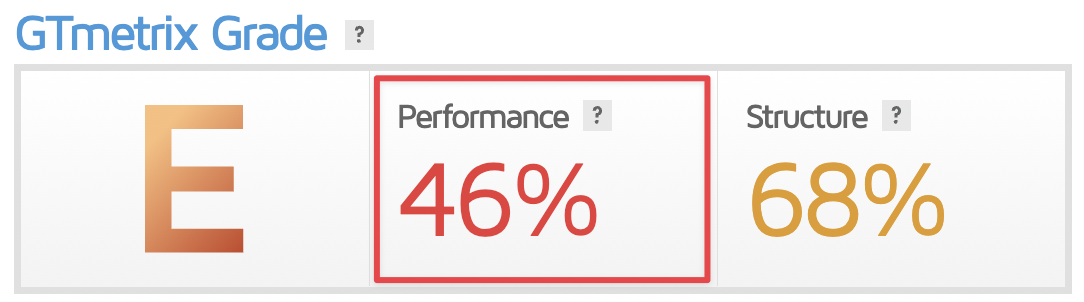
GTmetrix scoring evaluates the performance of your page in terms of load, user interaction, and visual stability and provides a result. This scoring provides a healthy representation of the overall web experience as both frontend structure and actual performance are included.
However, GTmetrix calculates 2 types of scores. These are called Performance Scores and Structure Scores. Performance Score is your Lighthouse score from GTmetrix's tests and shows how well your page is structured from a user perspective.
Performance Score
When calculating the metric called Performance Score, basically 3 topics are taken into account. These are; Loading Performance, Interactivity, and Visual Stability.
Loading Performance has a 45% impact on the Total Performance Score. Core Web Vitals metrics First Contentful Paint and Largest Contentful Paint are important for Loading Performance.
The engagement score is affected by engagement and blocking time. It affects the Total Performance Score by 40%.
Visual stability is directly related to the Cumulative Layout Shift metric, which we are familiar with from Web Vitals metrics, and has a 15% impact on Performance Score.
In summary, the structure is as follows.
Loading performance (45%)
- First Contentful Paint (10%)
- Speed Index (10%)
- Largest Contentful Paint (25%)
Interactivity (40%)
- Time to Interactive (10%)
- Total Blocking Time (30%
Visual Stability (15%)
- Cumulative Layout Shift (15%)
To better understand the analysis, let's briefly detail what each metric means.
First Contentful Paint: The time it takes for the first painted element on the page to load. A maximum of 1.8 seconds is recommended.
Speed Index: It is a metric that measures how fast the page content can be loaded, that is, how fast it can be displayed visually. A maximum of 3 seconds is recommended.
Largest Contentful Paint: The time it takes for the largest paintable element on the page to load. The largest paintable content on the page is usually an image. However, the maximum time it takes to load is recommended to be 2.5 seconds.
Time to Interactive: This refers to the time it takes for the page to become fully interactive. It refers to the loading of all sub-resources, that is, the loading of the entire page. It is recommended to be a maximum of 3.8 seconds.
Total Blocking Time: Measures the loading time of each task between First Contentful Paint and Time to Interactive. It is the metric that measures the blocking time created by loads that take more than 50 ms during the page creation process. Here, it measures how much the tasks loaded over 50 ms exceed the 50 ms value and collects those values. As a result, Total Blocking Time is calculated.
Cumulative Layout Shift: This metric measures the visual stability of the page. It calculates the shift rate of images, fonts, and buttons during loading and at full load. Values below 0.1 are considered good.
By calculating all these metrics, the final Performance Score result is obtained. You can also access the details of your performance score from the Performance tab. Along with your performance scores, you can find information about which section of your page needs more time to respond in the Browser Timing section below. I would like to point out that the data in Browser Timing does not directly affect your Performance score.
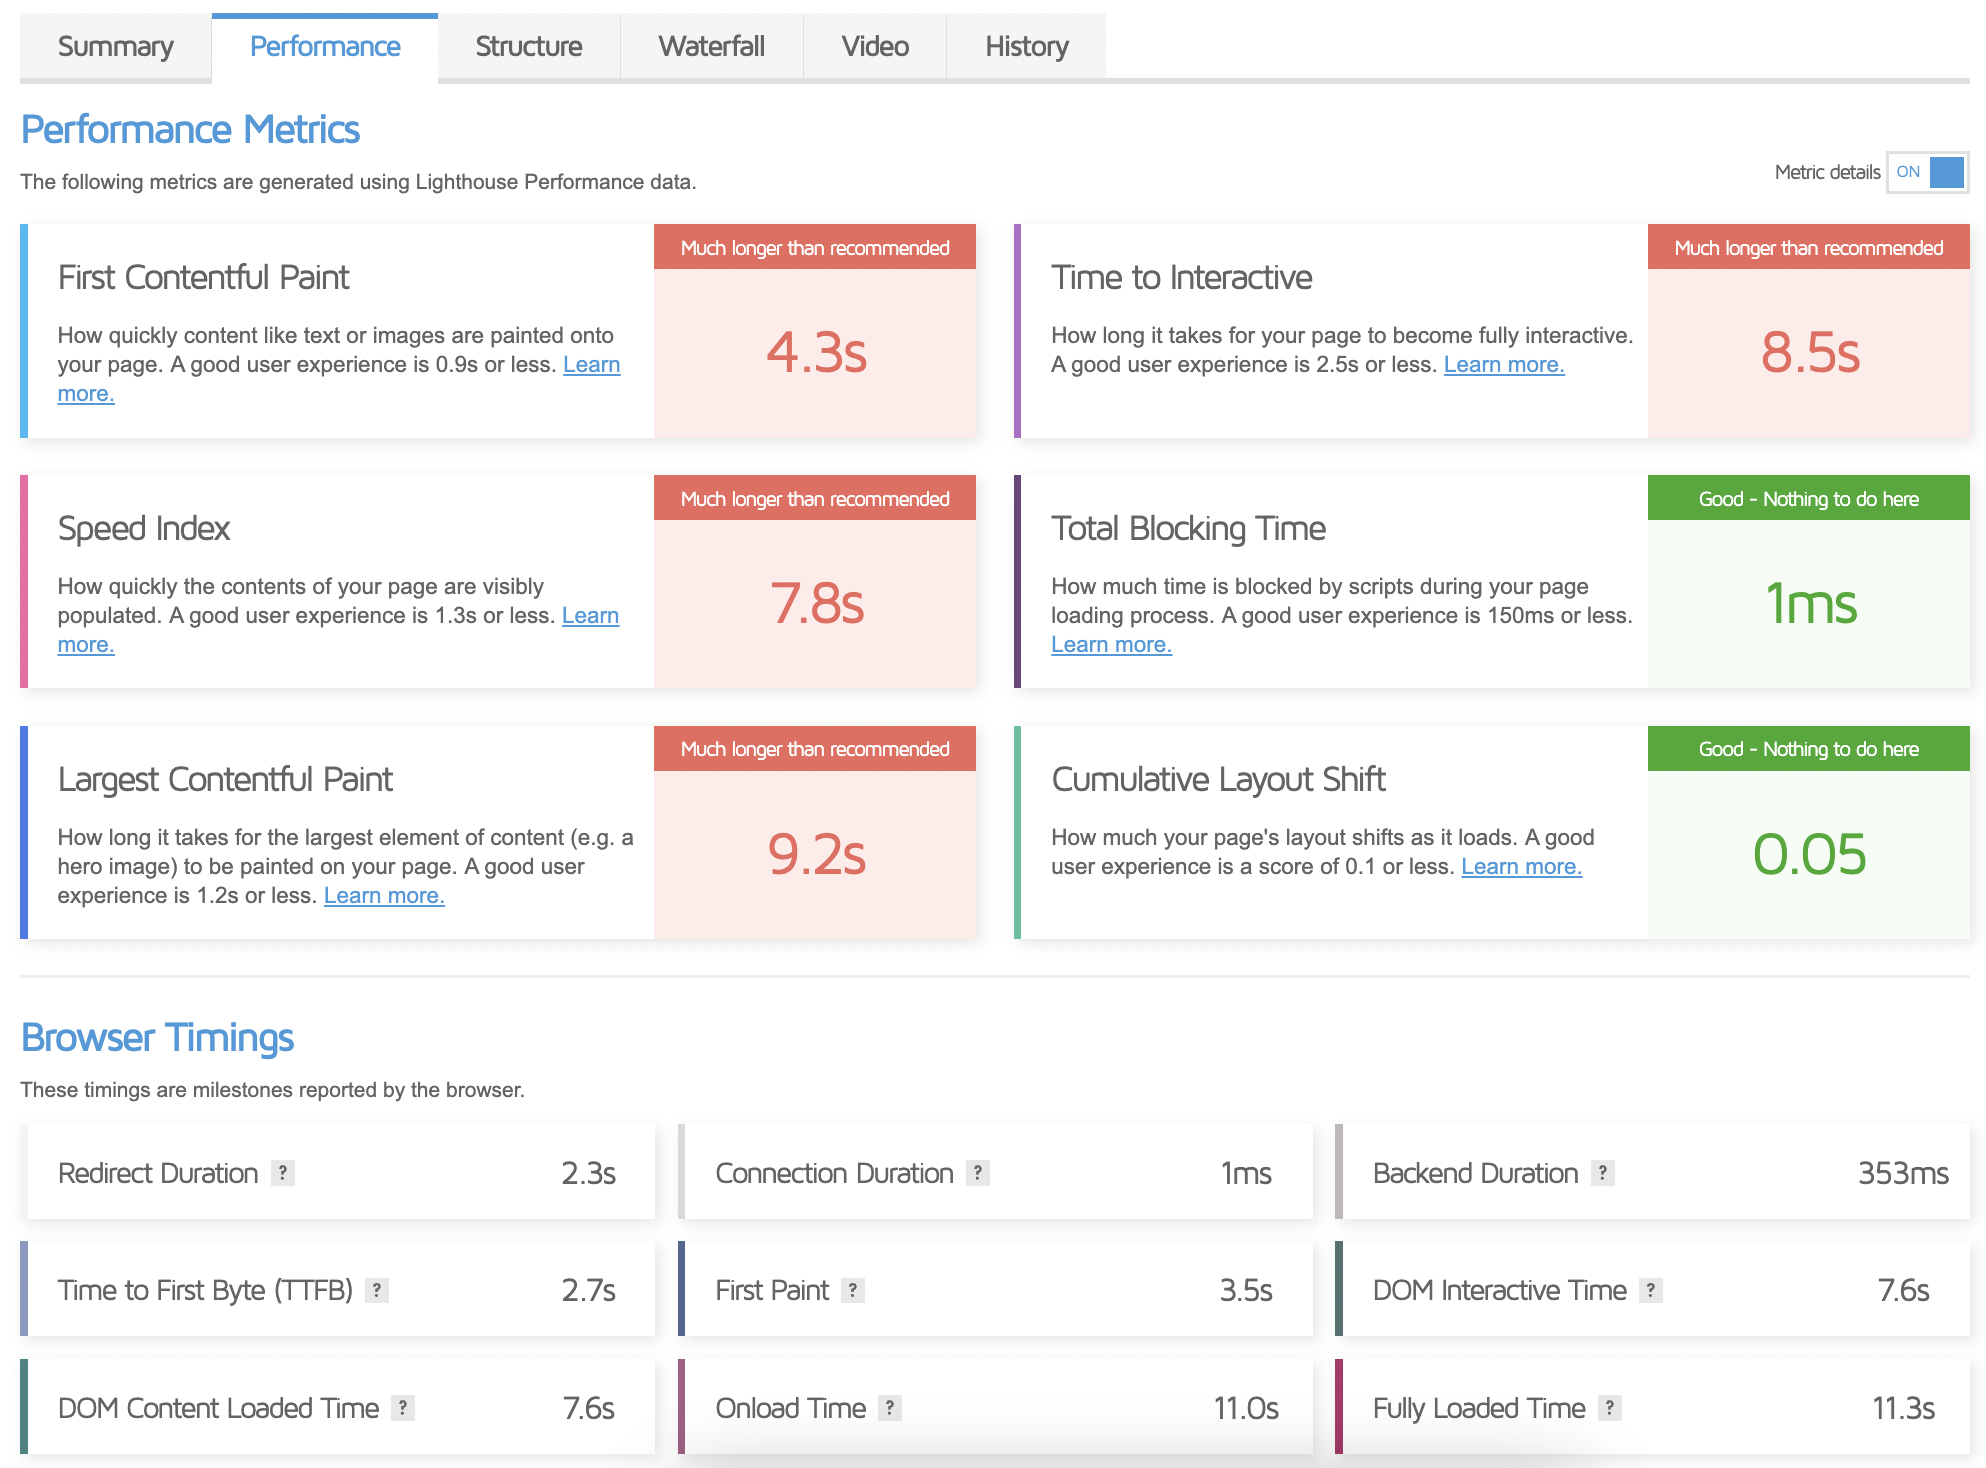
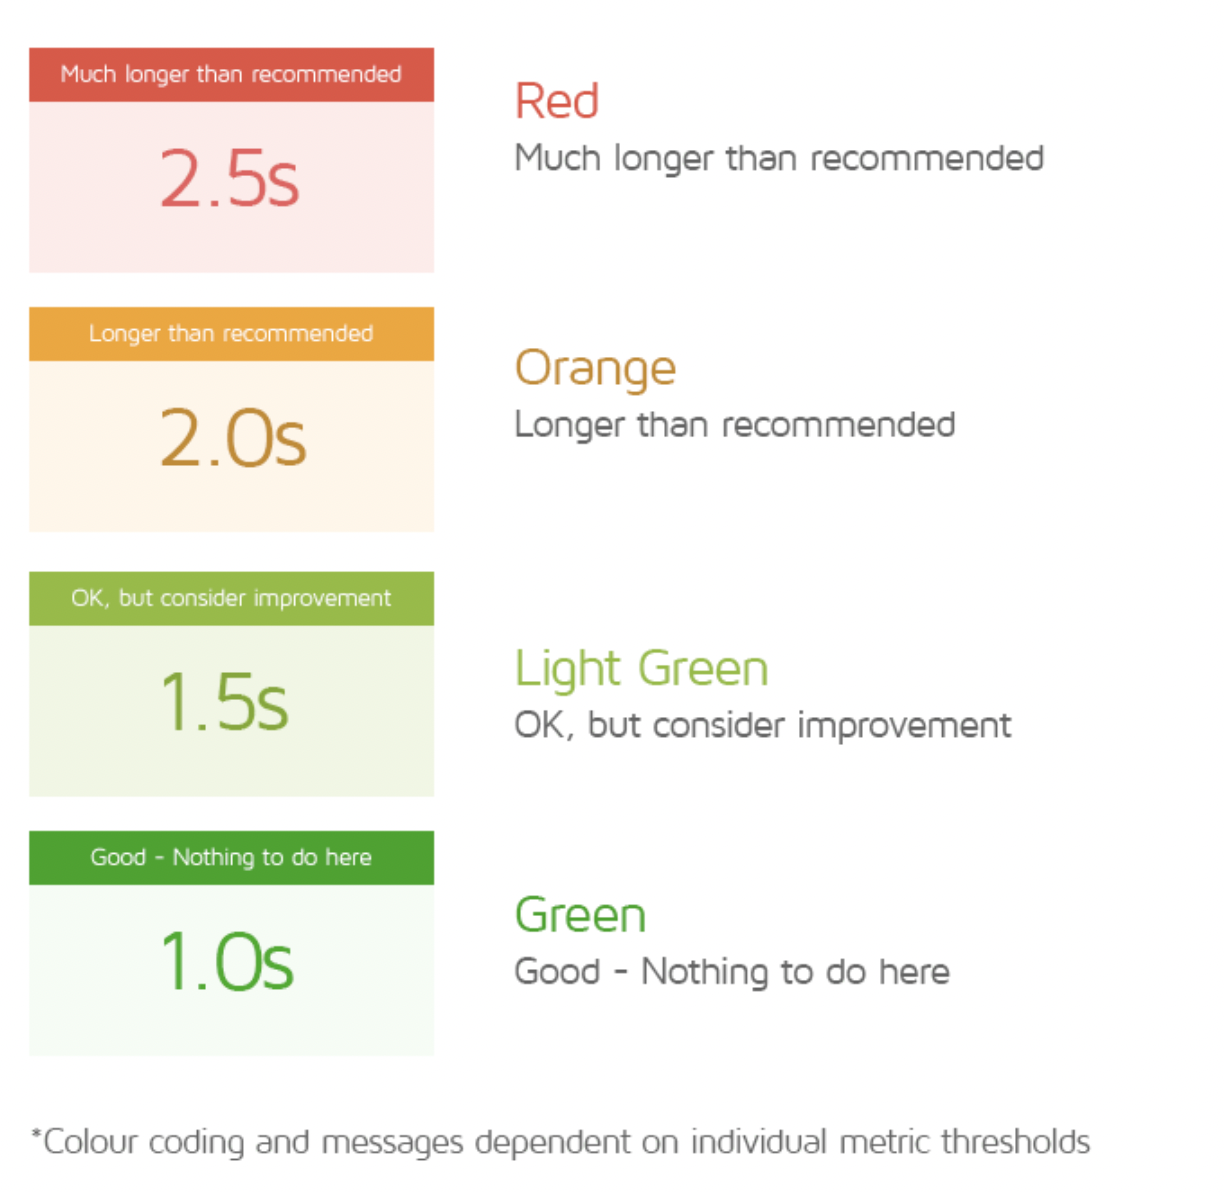
In this area, you will see the following colors and messages depending on the performance of the metric calculated for your site.
Structure Score
Structure Score is the value that shows how well your page is built for optimal performance.
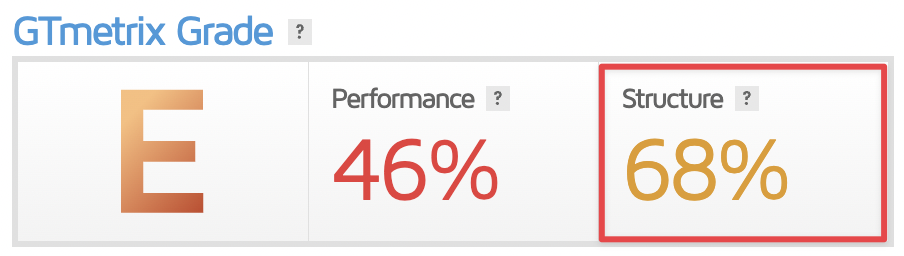
In addition to the standard Lighthouse scores, we mentioned that GTmetrix has special checks on web performance. These checks are included in the Structure Score section.
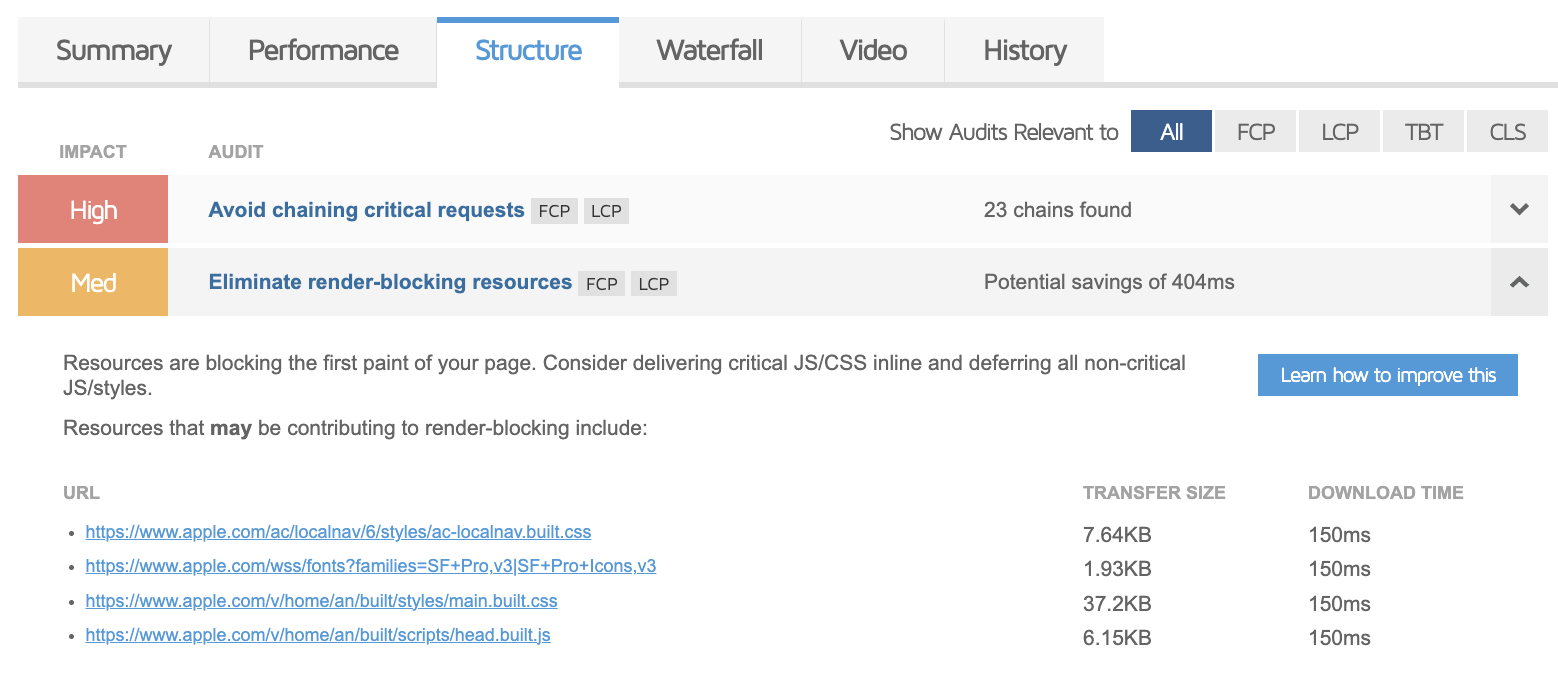
You can find detailed information about Structured Score under the Structure heading. Here you will see a report like the one below, with the most serious problem at the top.
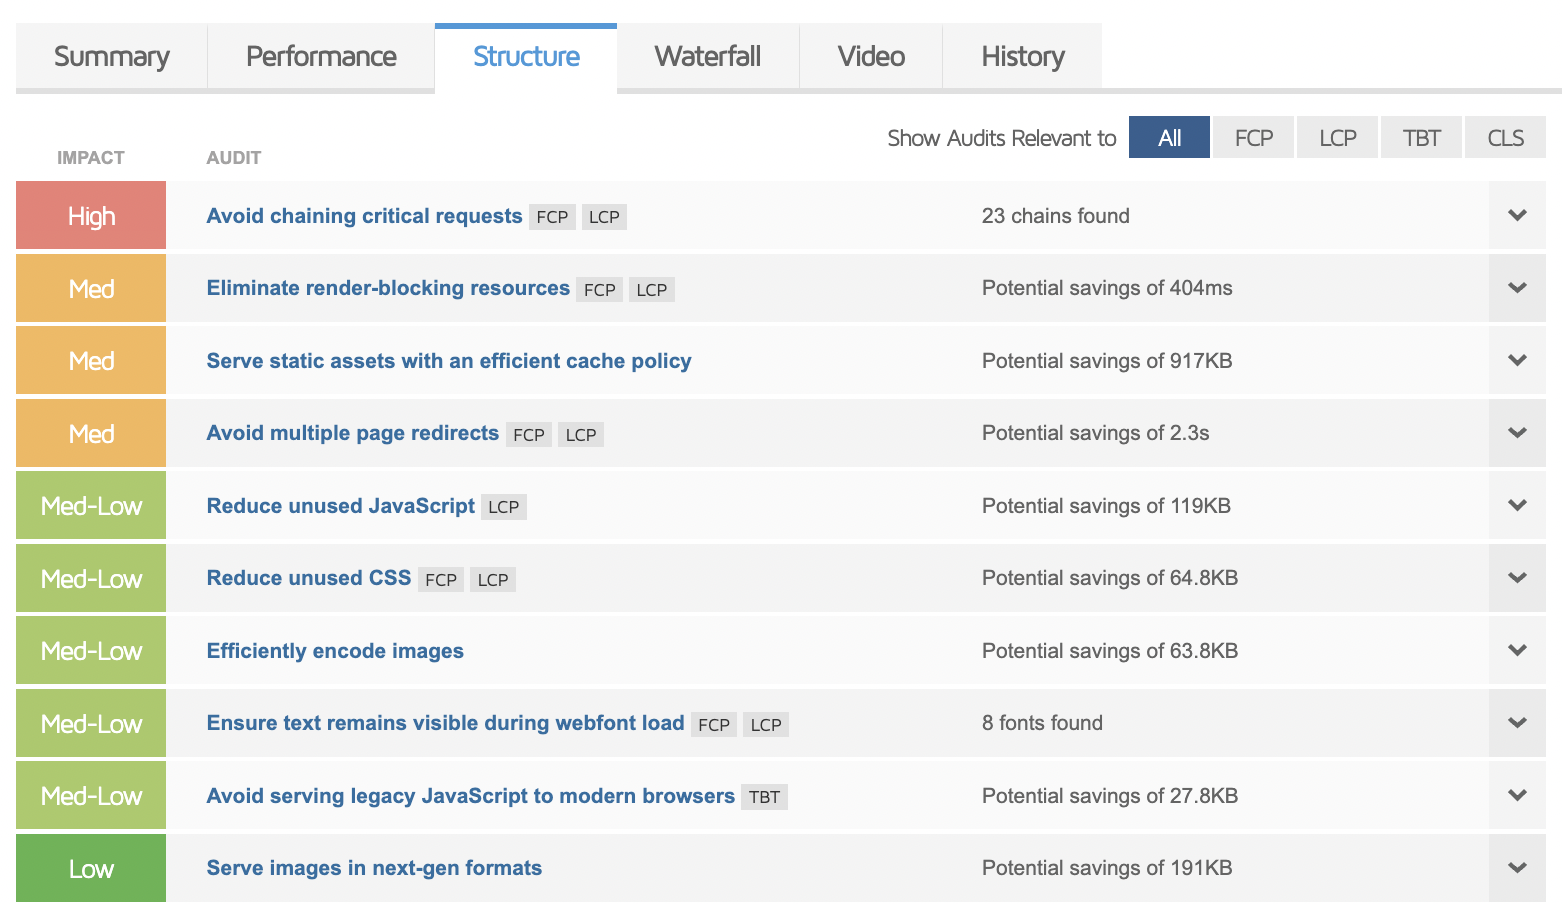
Click on the title of each question for a more detailed explanation.
We can interpret the items shown in this table according to their colors as follows.
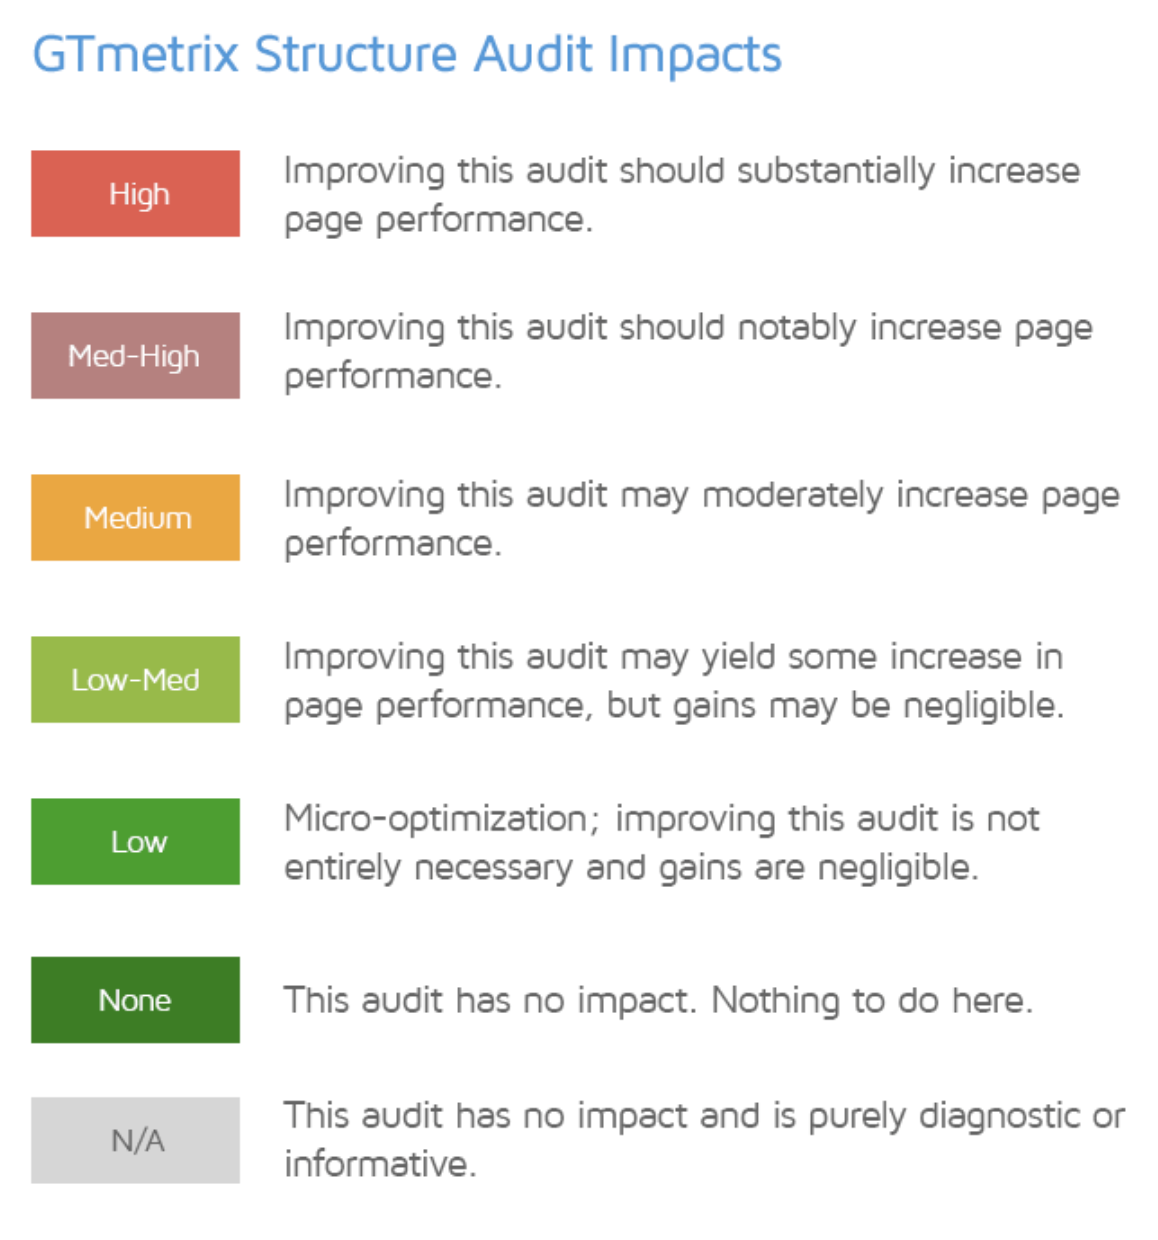
Improving the items designated as 'High' and 'Med-High' will significantly improve the performance of your page while improving the items designated as 'Medium' will affect your page less. Since these are the items that will have the most impact, it would make more sense to prioritize these items and start improvement efforts. Since the items colored in green indicate that you are already in good condition, the work to be done on these items will not have a significant direct impact on your page.
Web Vitals
In May 2020, Google announced the key metrics we should focus on for faster site performance with Core Web Vitals.
GTmetrix offers us the following values with its tests in line with these metrics.
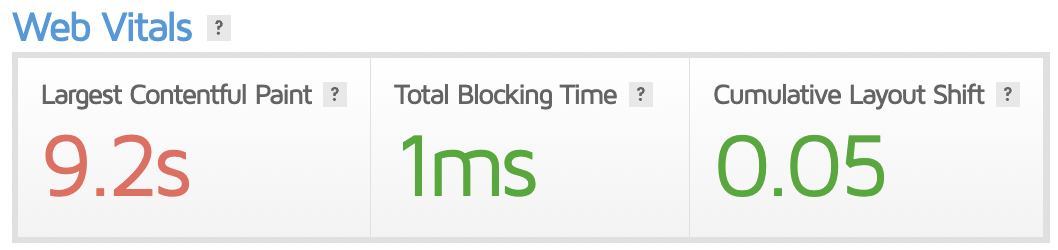
If we talk about these metrics briefly:
Largest Contentful Paint (LCP) is how long it takes to display your largest content; Total Blocking Time (TBT) is how much time is blocked by scripts during page load. Cumulative Layout Shift is related to how much layout shift your user experiences while your page is loading.
The Summary Tab
In the Summary field, GTmetrix gives us a summary view of our page's performance and behavior on load. The problems and solutions presented in this area are largely sufficient to improve page performance, so you can consider this as a source for actions to be taken in the site speed reports you prepare with GTmetrix.
At the top of the Summary area, we see the Speed Visualization area. Here you can observe the user's experience while your page is loading.
Next, in the Top Issues area, GTmetrix shows us the problems with our page performance and offers suggestions, just like Pagespeed Insights. As you improve the issues presented here, you can also track improvements in your site speed by retesting with GTmetrix.
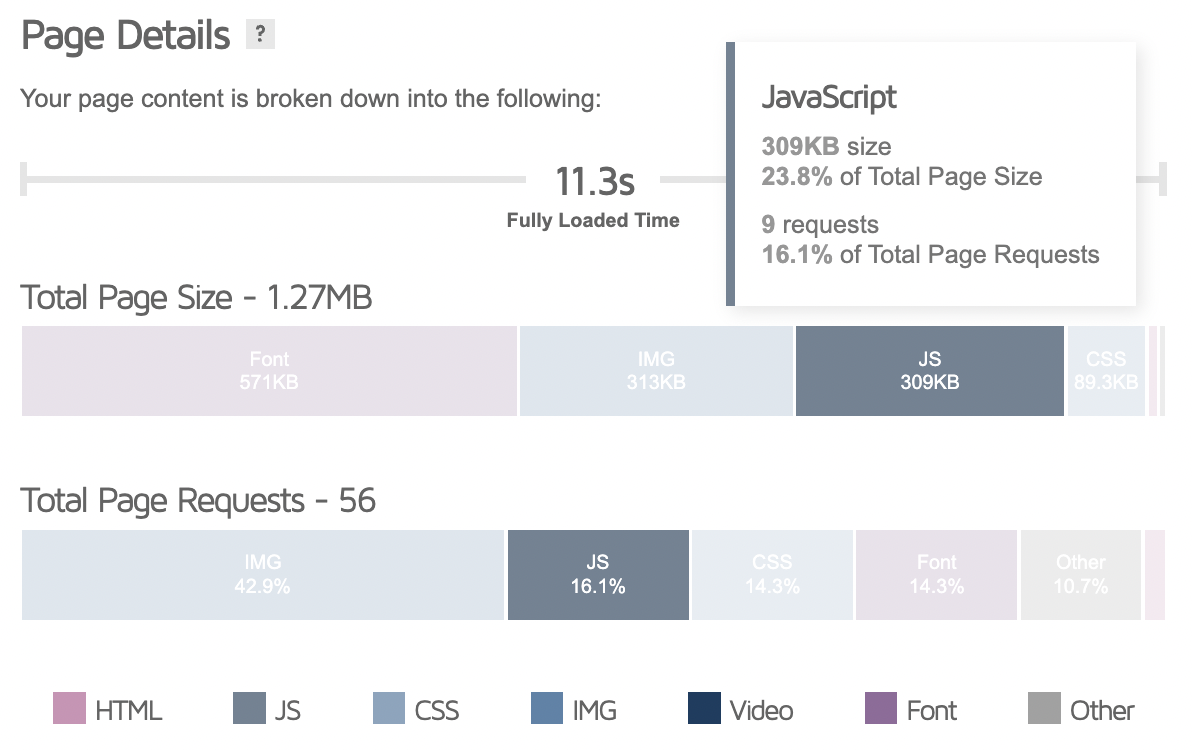
In the Page Details area, you can see the number and types of requests coming to your page, along with the size (bytes) they generate.
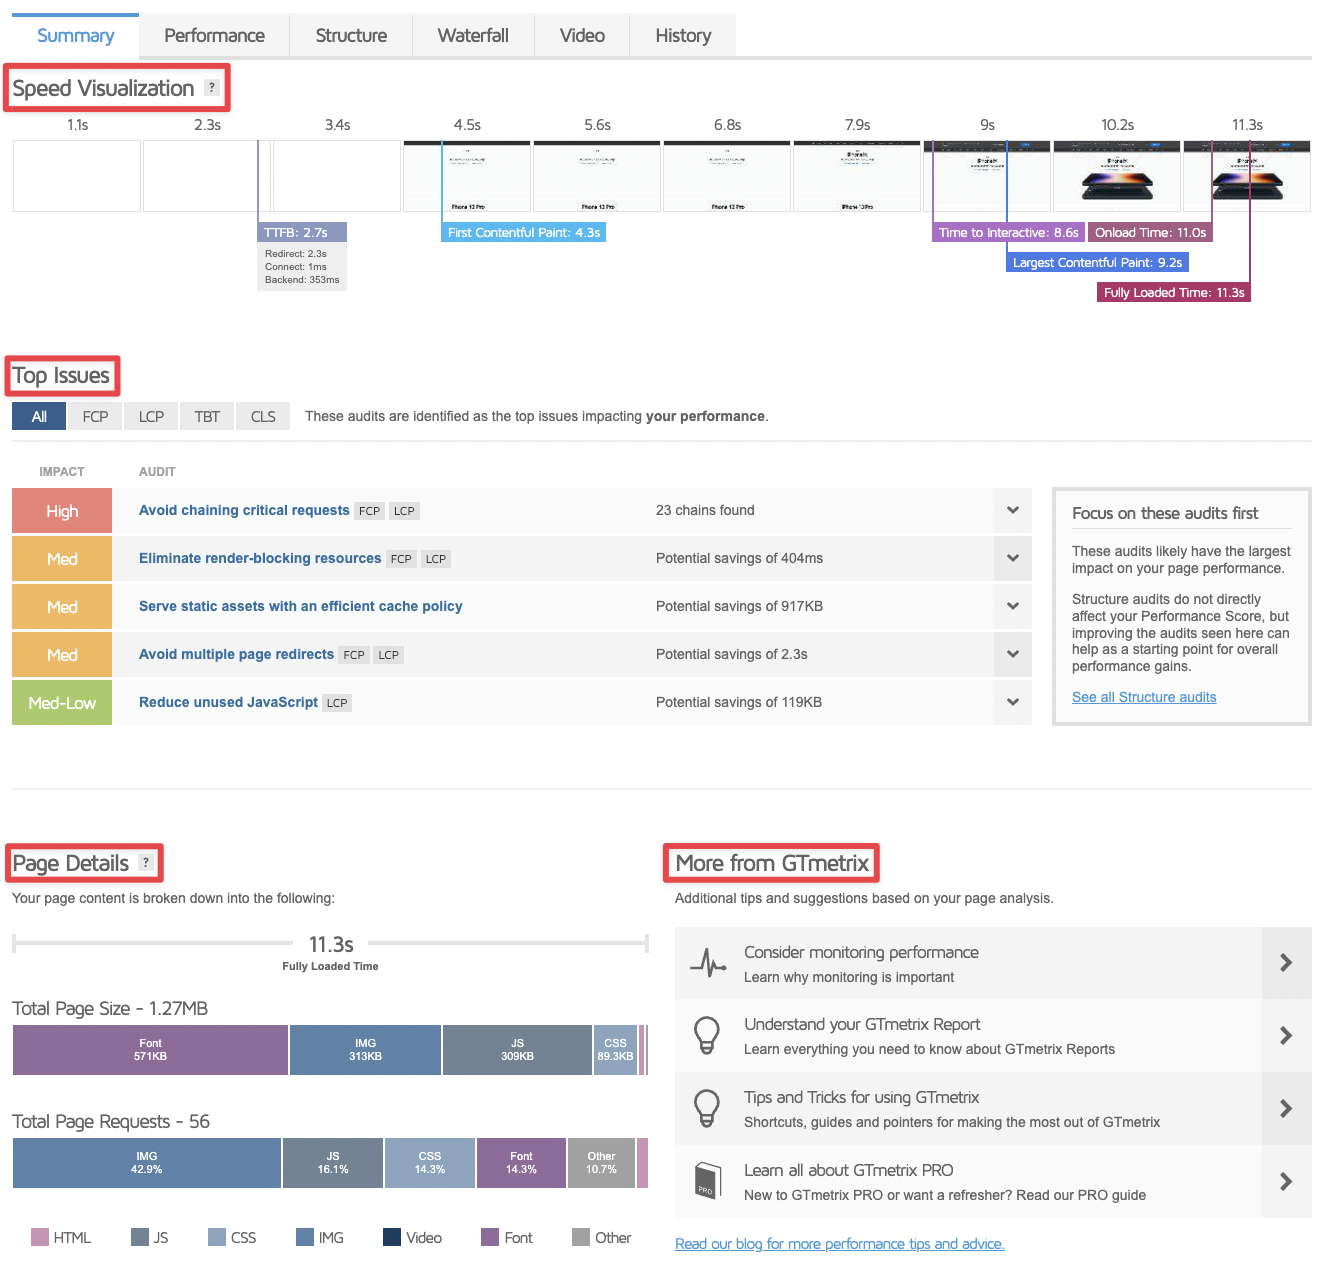
From the Page Details section, you can access more detailed descriptions for each description by hovering over it with the mouse.
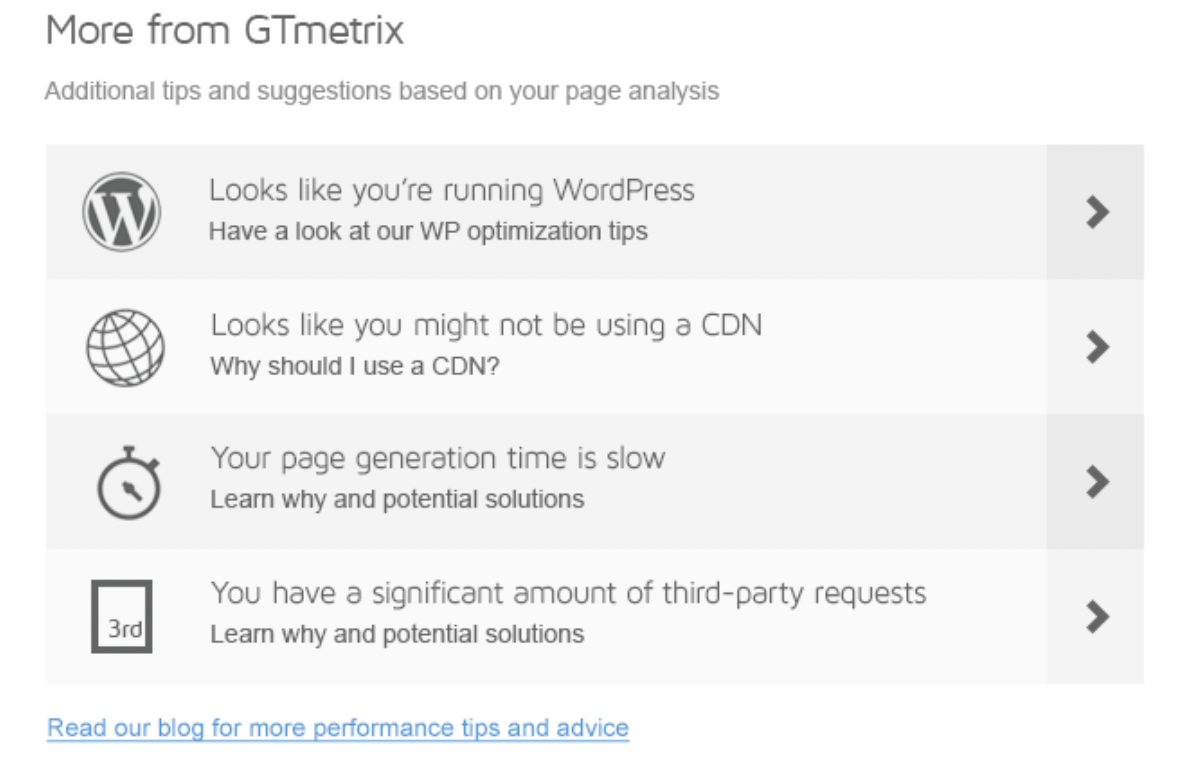
The last title in the Summary area is More from GTmetrix. In this title, GTmetrix offers you suggestions with the information it has discovered while testing your site. For example; If it is determined that you are using WordPress or Shopify infrastructure, you can access solution suggestions specific to the infrastructure you use from this area.
Light brown areas in the Waterfall header indicate files with blocking features. Therefore, the optimization of these files should be reviewed.
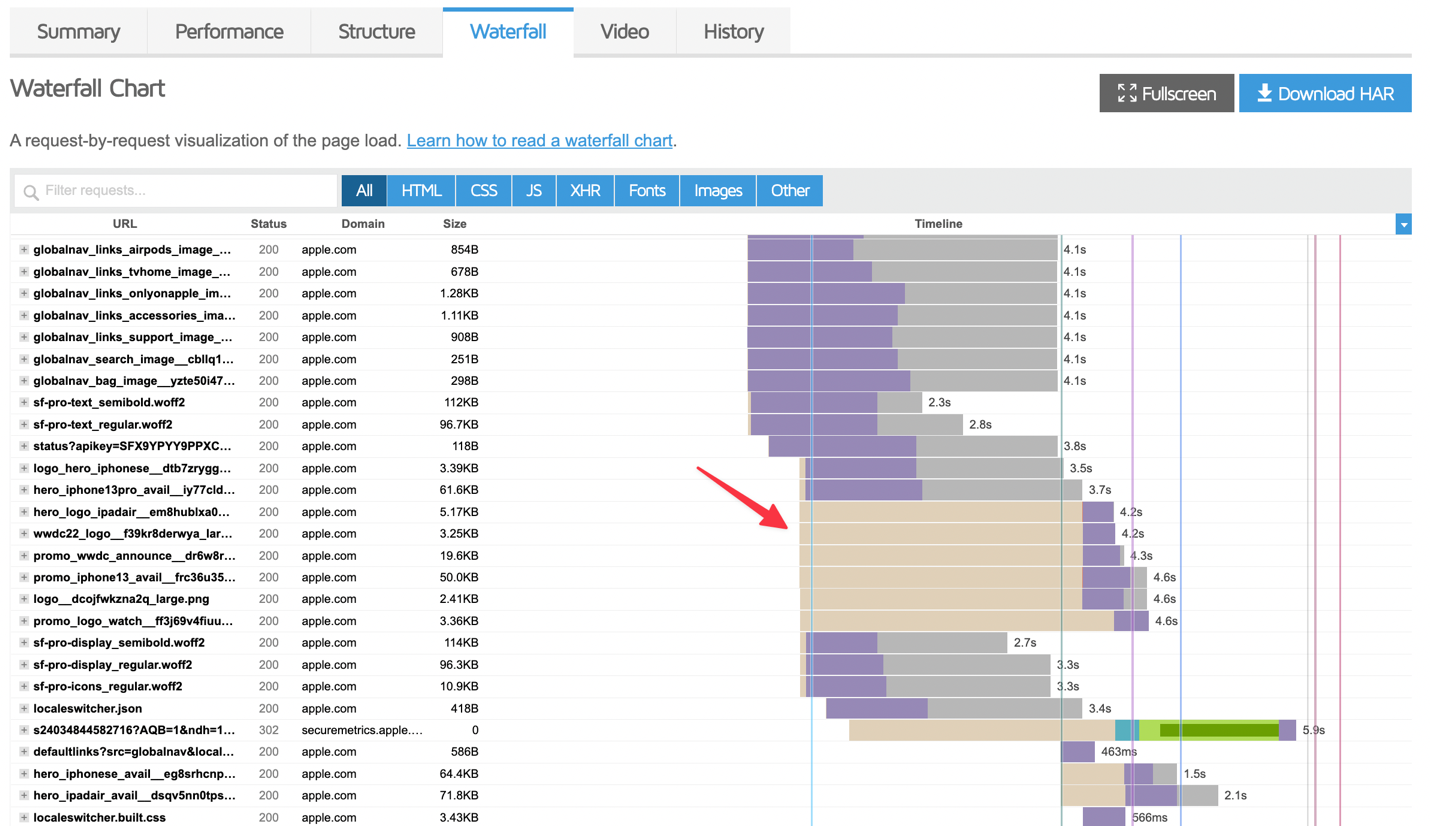
You can also access waterfall from the Network heading by right-clicking in your browser and then saying Review. I think GTmetrix is more useful.
I hope this blog, in which I tried to touch on many important points, was useful. See you in other blog content. :)
Resources:


