How to Perform a Technical SEO Audit with Google Chrome (20 Tips)
The Google Chrome browser we use every day can also play an active role in your SEO efforts. For this, you can speed up your analysis even by knowing very simple operations. In this article, I tried to explain how Google Chrome Developer Tools can be used in terms of SEO. I tried to collect the most important features in my article. I would like to point out that friends working on the front-end or back-end side of course use more and different commands and options.
Google Chrome Developer tools of course do not replace the data you get from other powerful SEO crawler results, but it provides such interesting data that I recommend you to use it when doing technical SEO audits.
You can open Chrome developer tools by following the steps below. You can also open this panel with Windows (CTRL+Shift+I OR F12) or Mac (Command+Option+I) shortcuts.
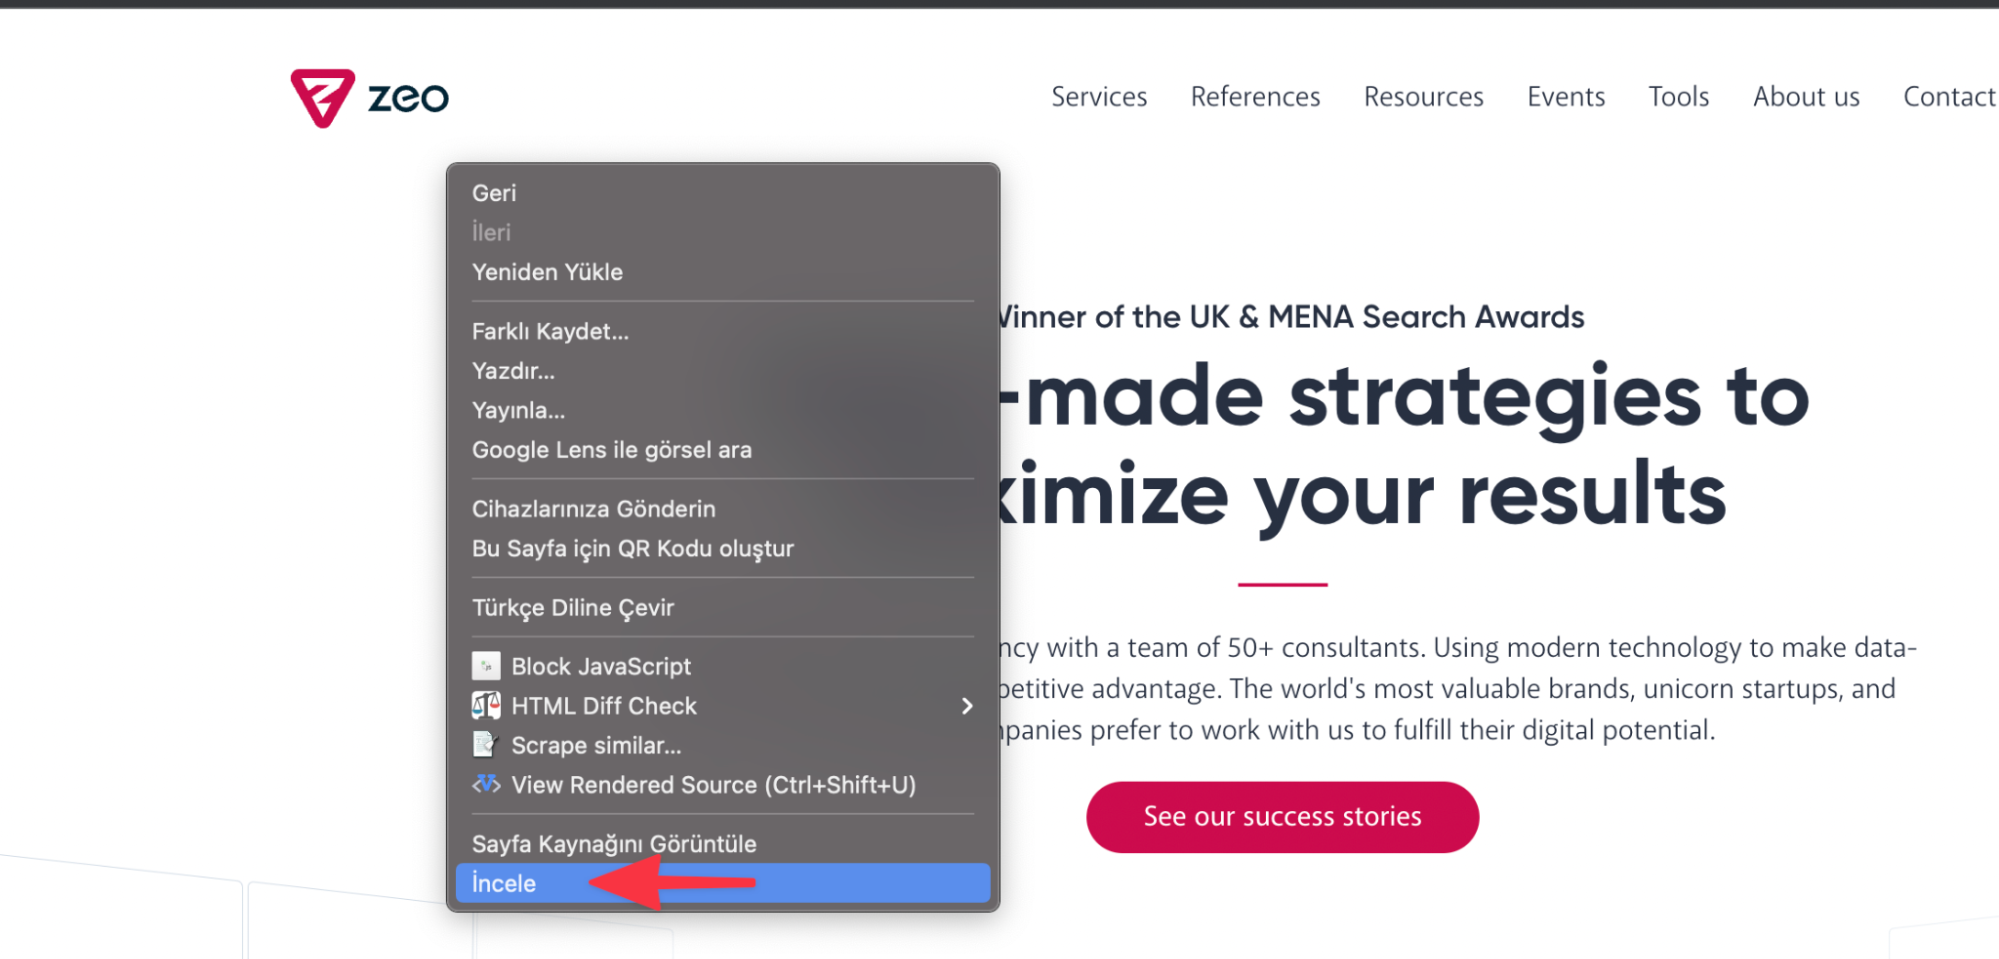
The important options you can make in your SEO efforts after the console is opened are in the subheadings below.
1. Status Codes
You can see which server response code the resources loaded on the page have. In this way, you can clearly identify the resources on the page that are redirected with 404 or 301, for example. You can see these response codes in the "Status" section. You can also use the following code to see, for example, the URLs on the page that only return a status code of 200.
status-code:200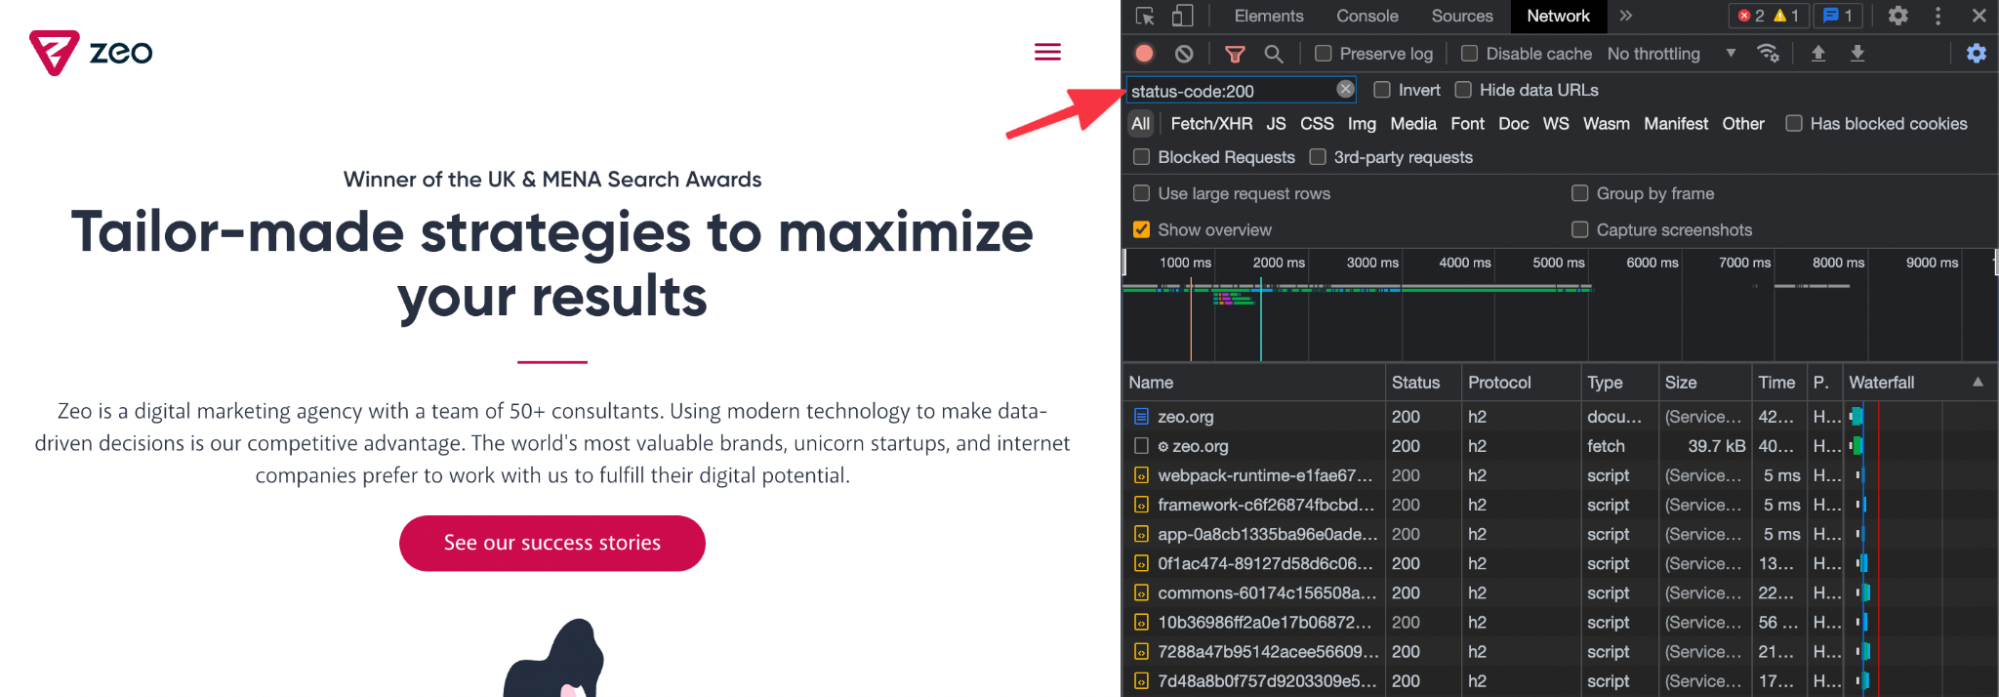
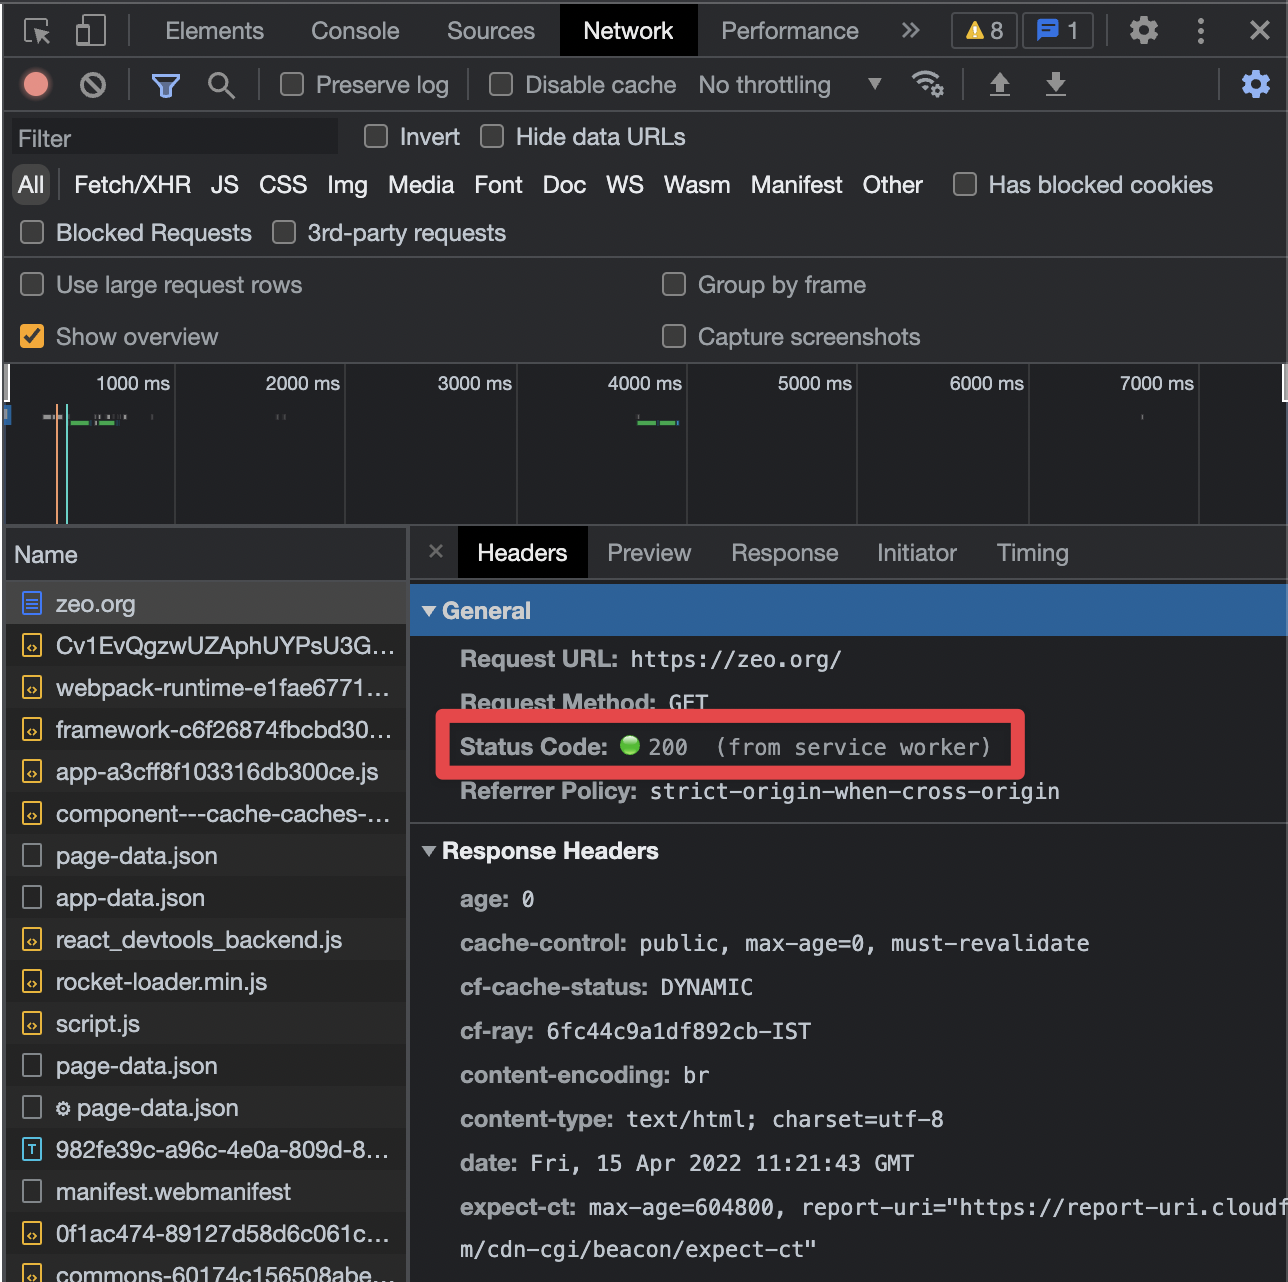
If caching is set up correctly on your server, you can see the 304 status code in this field, for example for resources that have never been modified. You can also examine all the details of the URL in the "Headers" section:
2. Domain-specific Results
From the resources loaded on the page, you can detect results specific to specific domains with the code below. This analysis will be useful for page types with a lot of resources.
-domain:*.hubspot.com

You can already see the domains when you start typing directly with -domain.*:

3. WordPress Plugins
You can see which plugins are included in Wordpress-based sites with the code below. If the wp-content path has not changed while installing in FTP, you can try this way. For example, in the screenshot below, I can understand that a plugin such as all-in-one SEO is used.

4. Waterfall
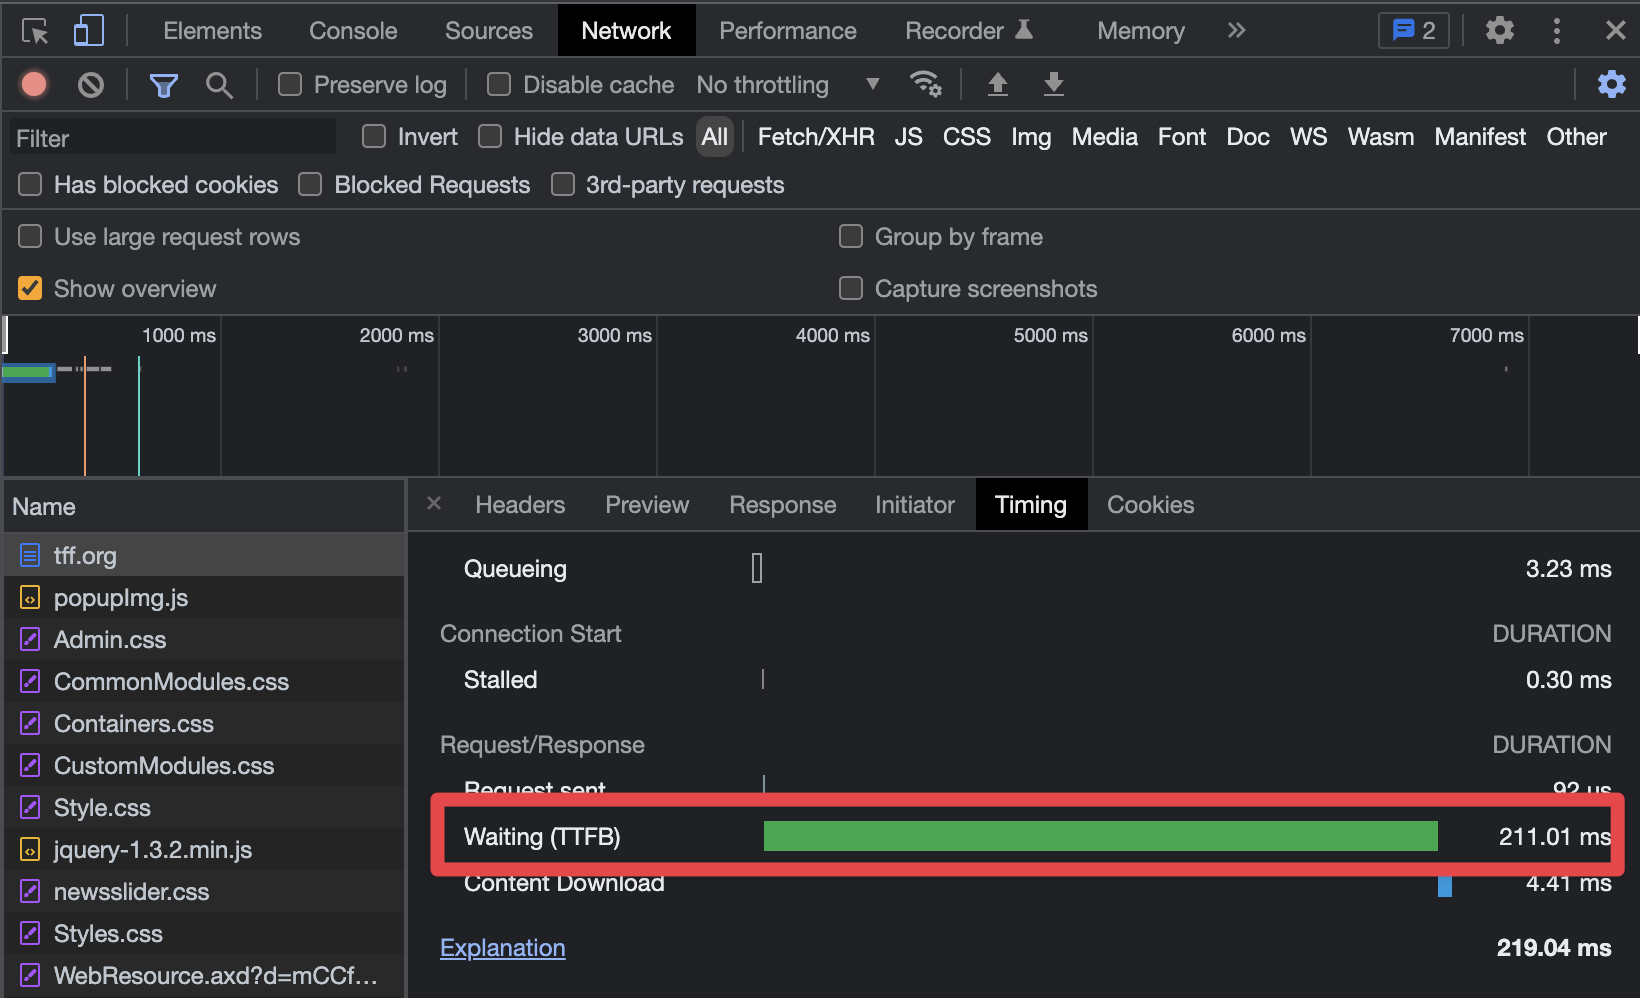
Chrome clearly shows you the waterfall status of the resources. You can analyze TTFB values as follows. In this way, you can identify the sources that affect the TTFB value the most.
5. Link Types
You can determine which link option is used on the page, such as nofollow or UGC, with the code below. After opening DevTools, just paste this code in the "Console" section and press Enter to see the result. I used nofollow as an example, you can also use it to see if there are tags like "sponsored".
$$('a[rel*=nofollow]')

6. Lighthouse Audit
You can analyze directly with the "Lighthouse" section in DevTools without installing a plugin on Chrome. You can see the results of the pages you want for mobile and desktop with one click and create your to-do's.
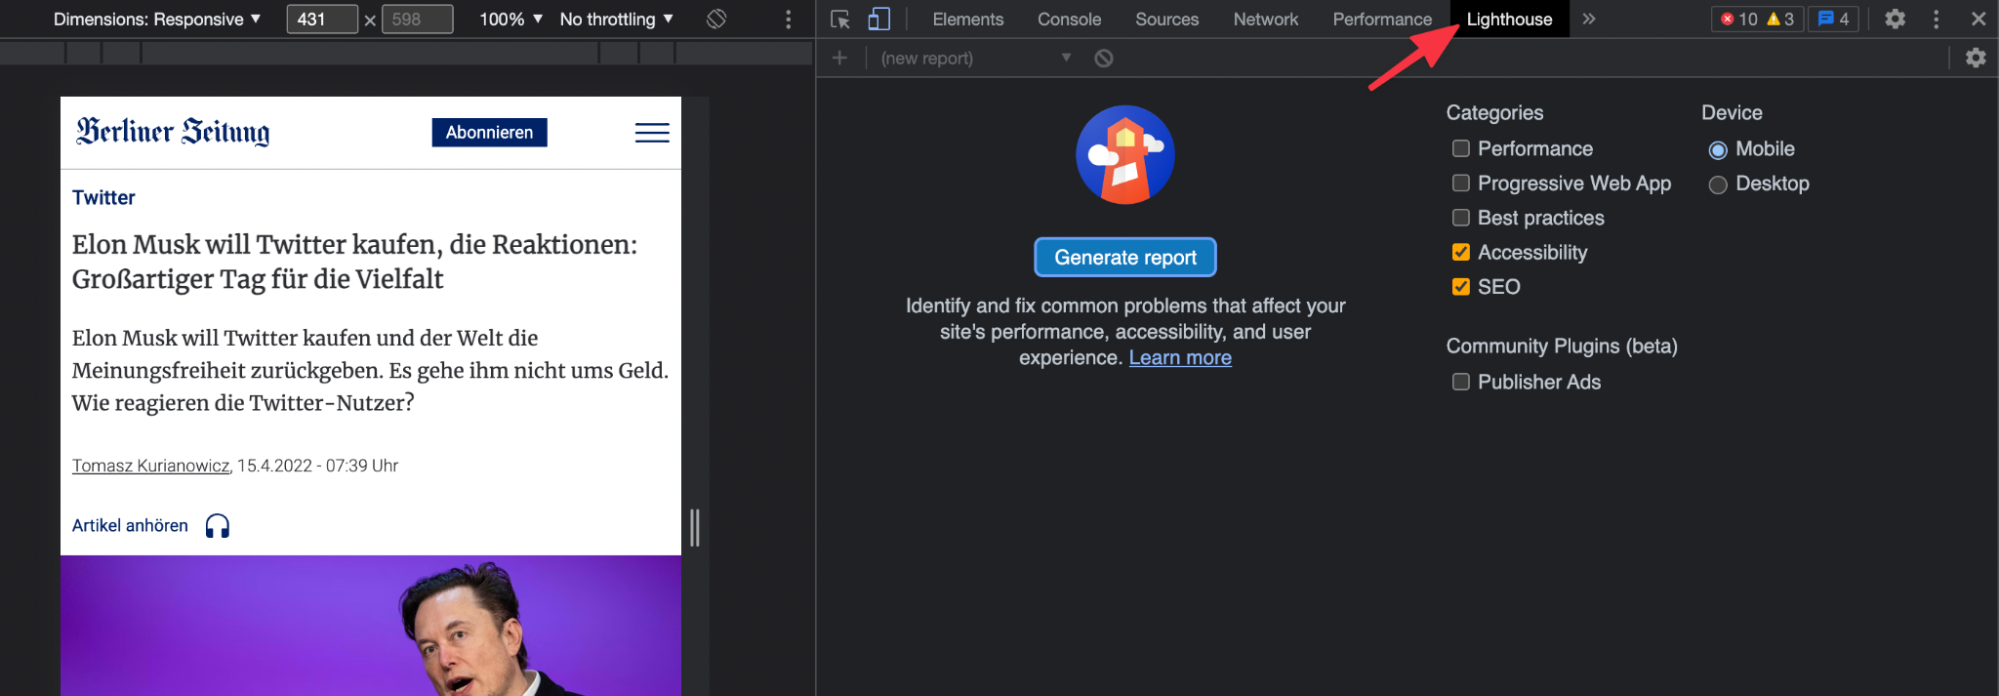
As you can see in the example below, you can access the results with a single click without additional effort:

7. Instant HTML Checks & Changes
It will be a very basic command, but you can click anywhere on the page in the "Elements" section to see which HTML tag it has and edit it live:
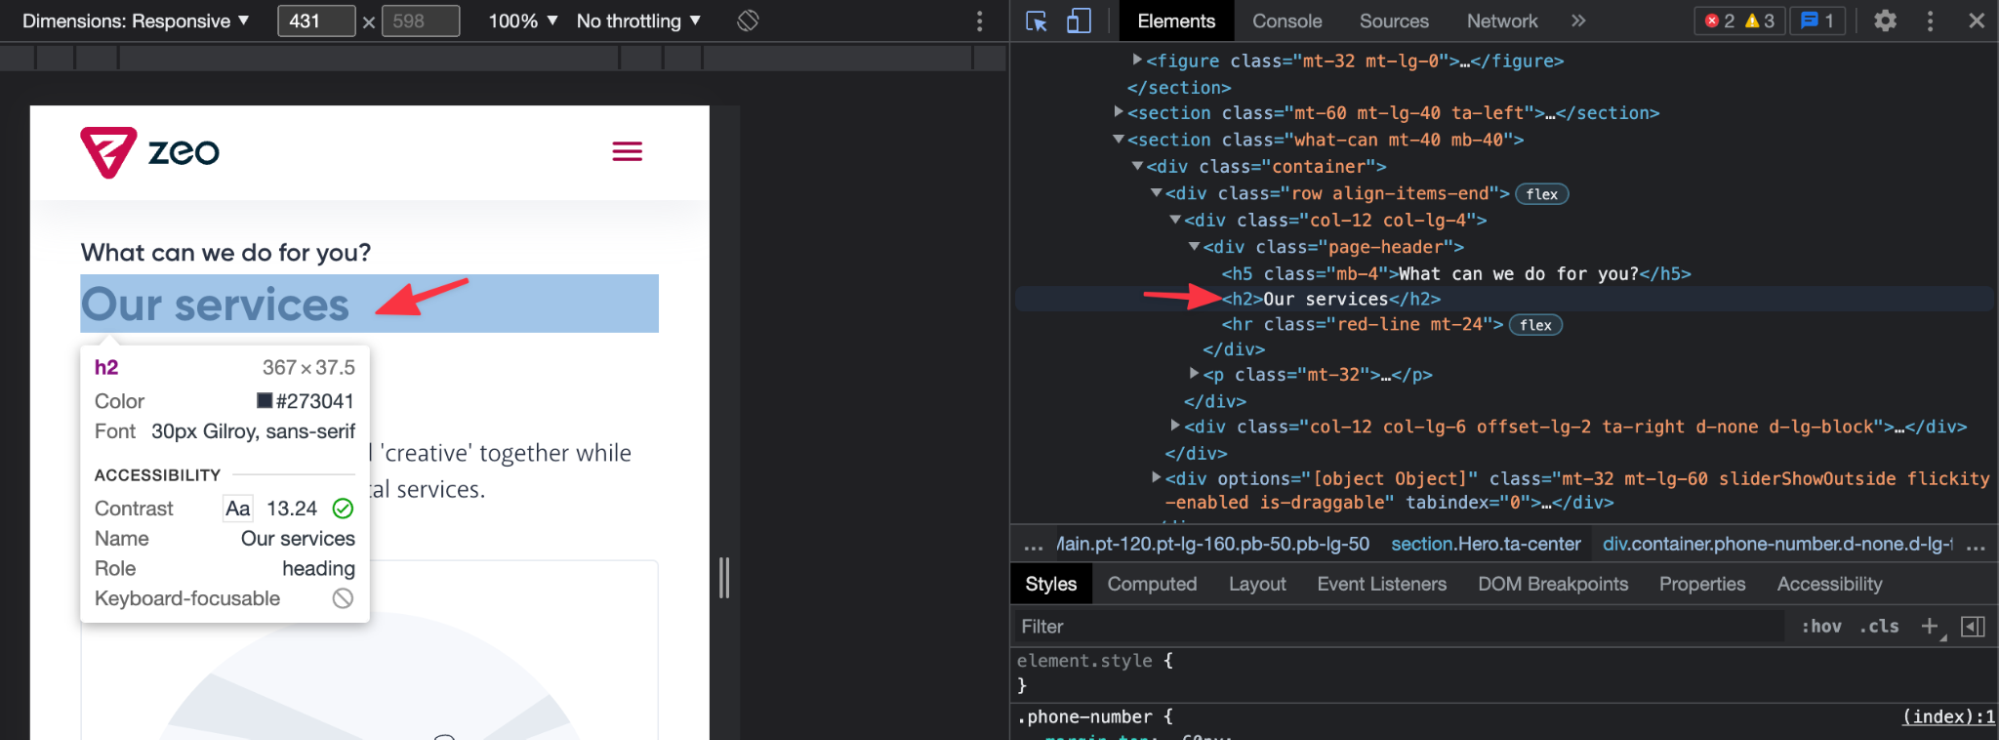
You can also change the part you want on the interface with the code below.
document.designMode = 'on'

8. Location Change
You can access the results of that city by entering the coordinates you want with Chrome. This can be especially useful when analyzing foreign competitors or doing SERP analysis on your multilingual sites.
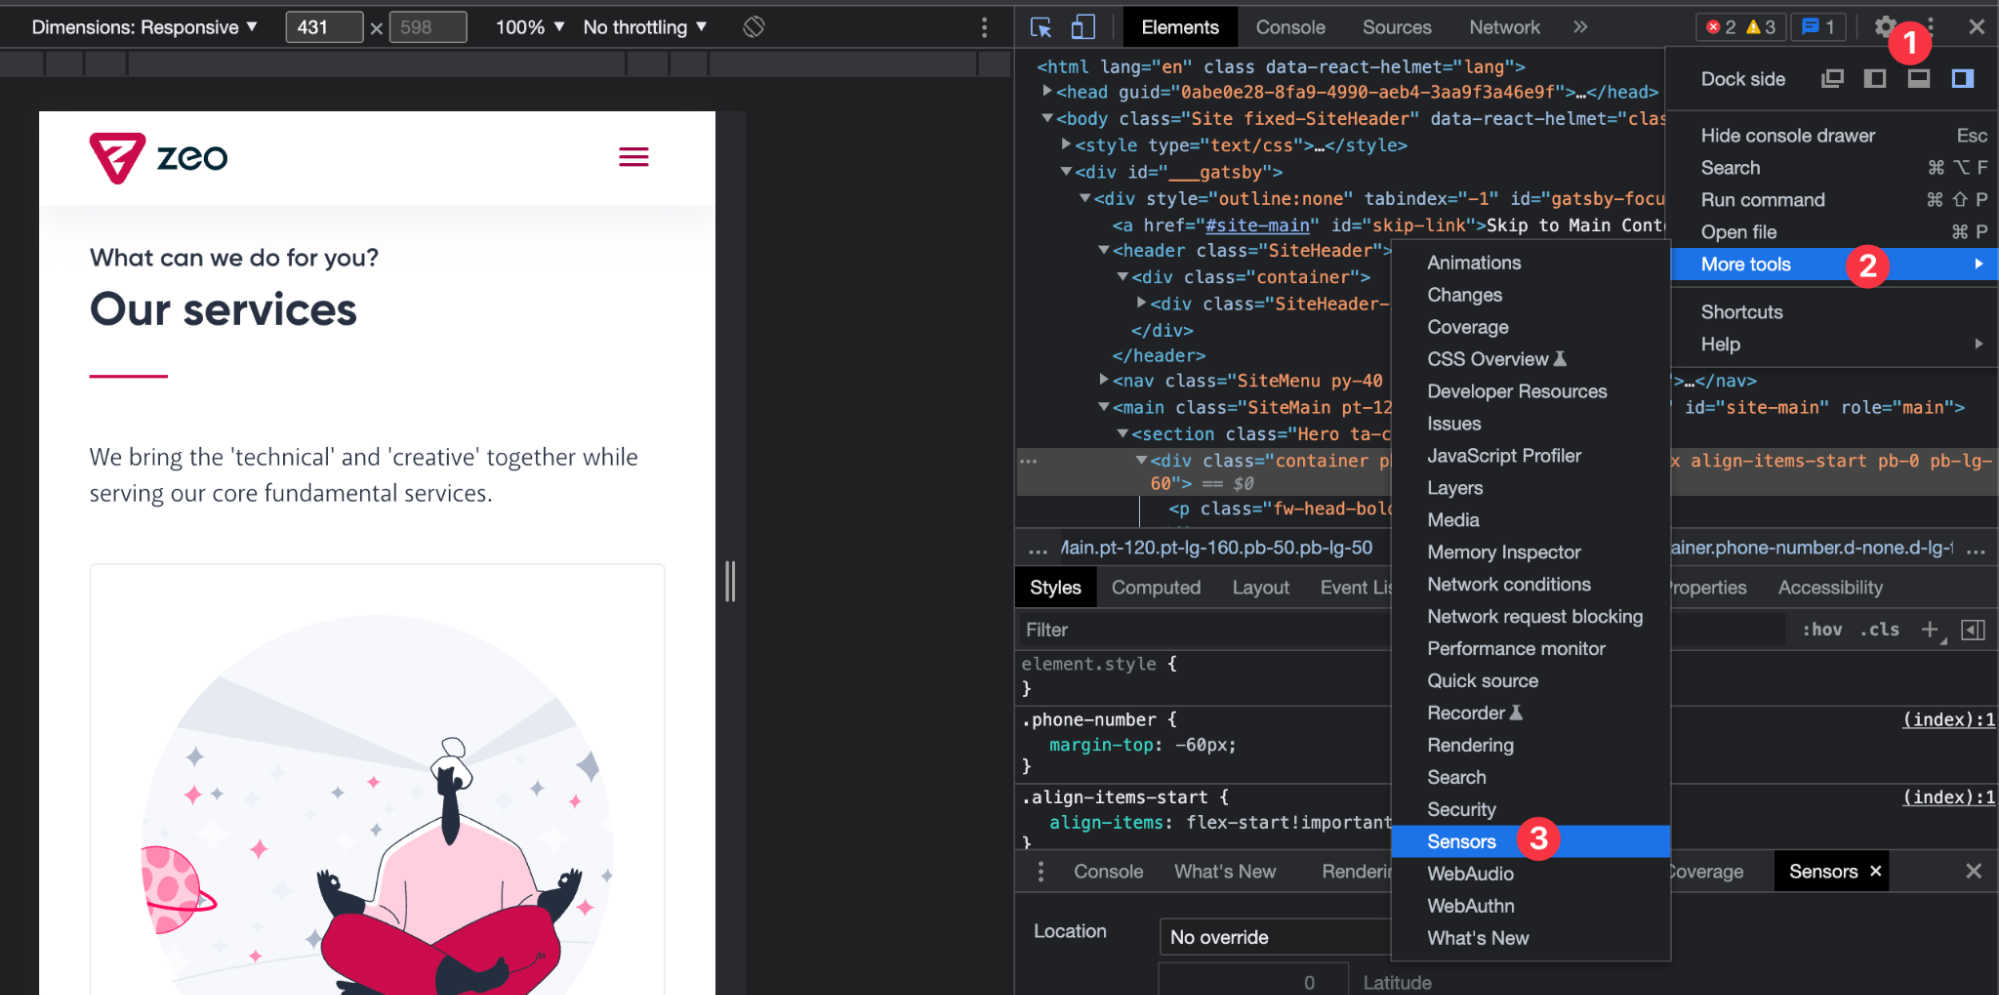
There are some cities that come ready-made under Sensor. For example, you can see Google results for Berlin directly from the Chrome browser you are using:
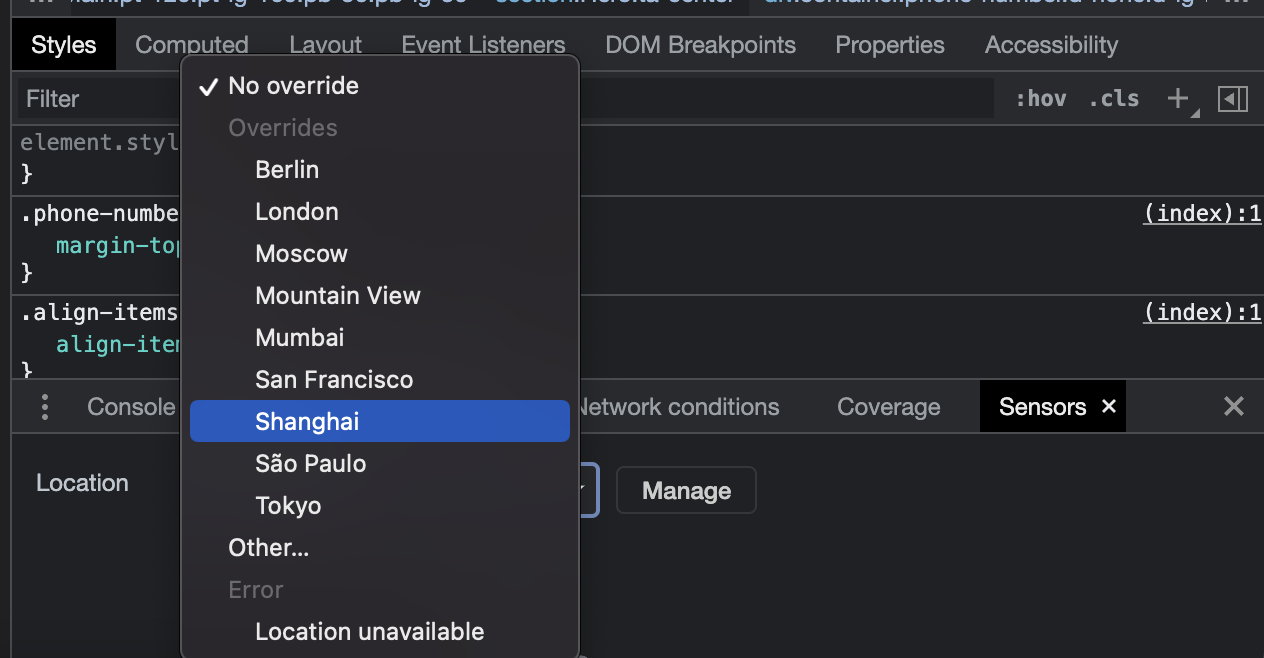
If you want to make a specific inspection, simply enter the coordinate information of that region in the fields below:

I also recommend Lokit - Local Search for Marketers plugin if you haven't installed it yet.
9. User-Agent Change
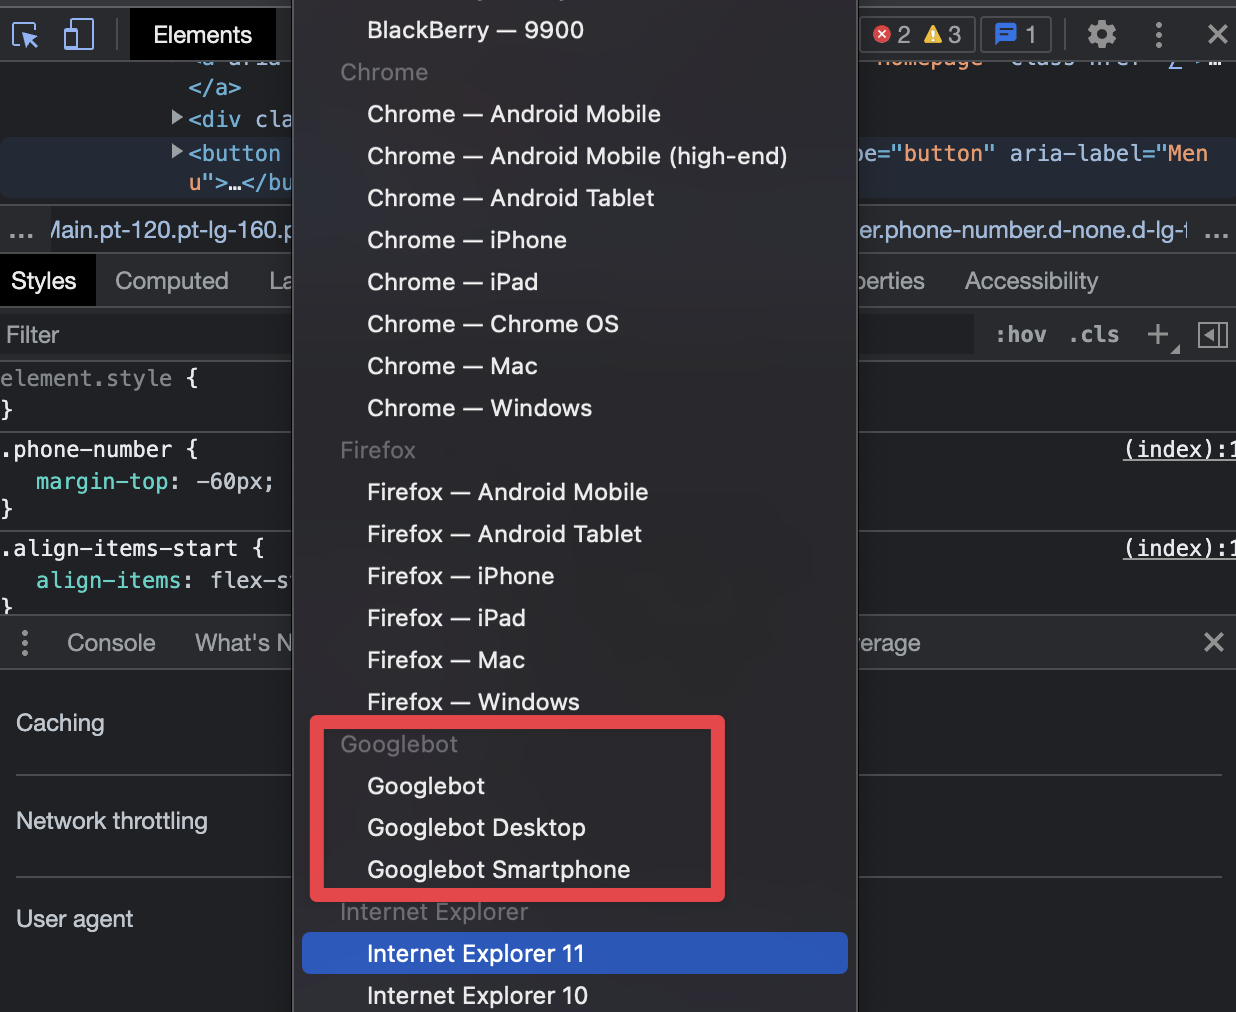
To see the page like Googlebot or to test how it looks on different devices like below, just go to the "network conditions" section:
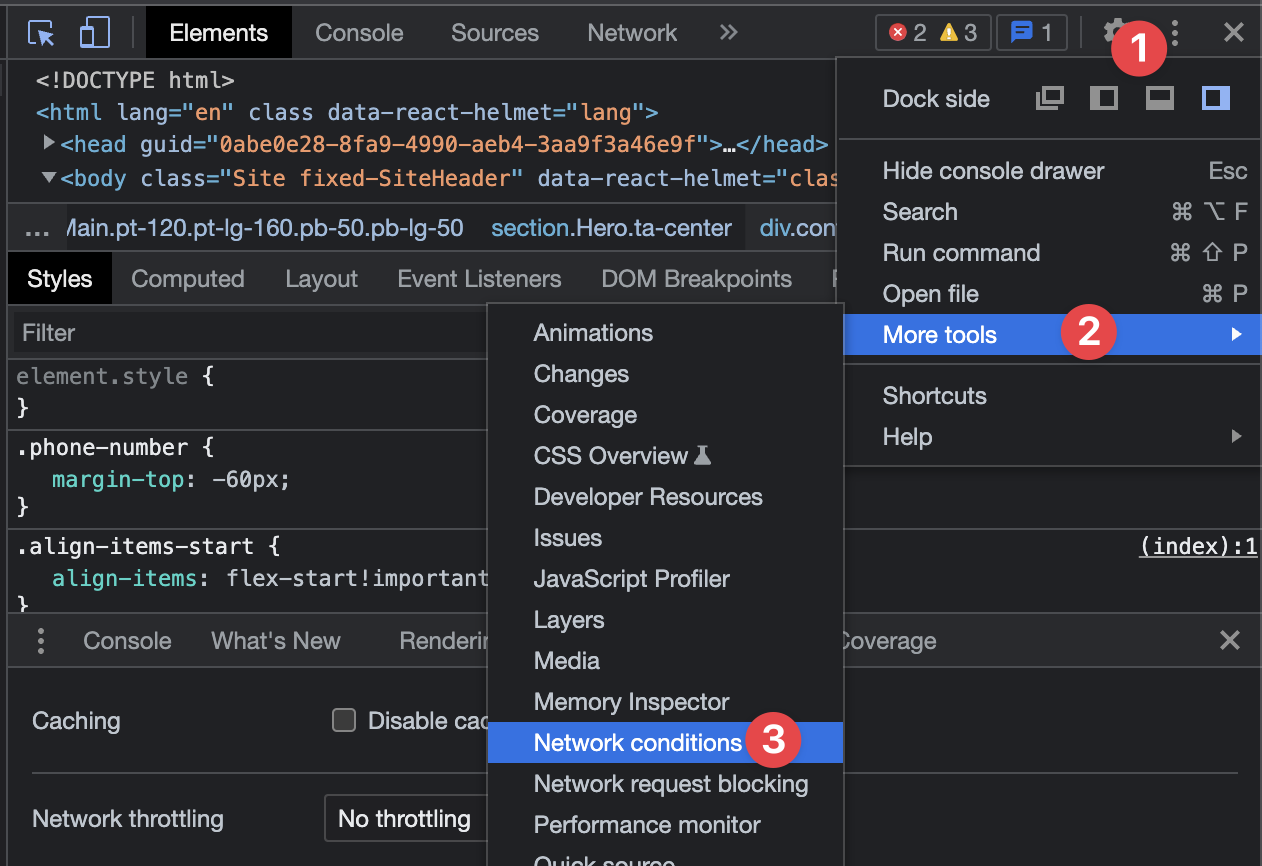
I've highlighted Googlebot as an example, but you can also use Internet Explorer, etc. Especially if you are working on topics such as Dynamic Rendering in Javascript SEO, you need to use this area frequently:
10. HTTP Protocol Controls
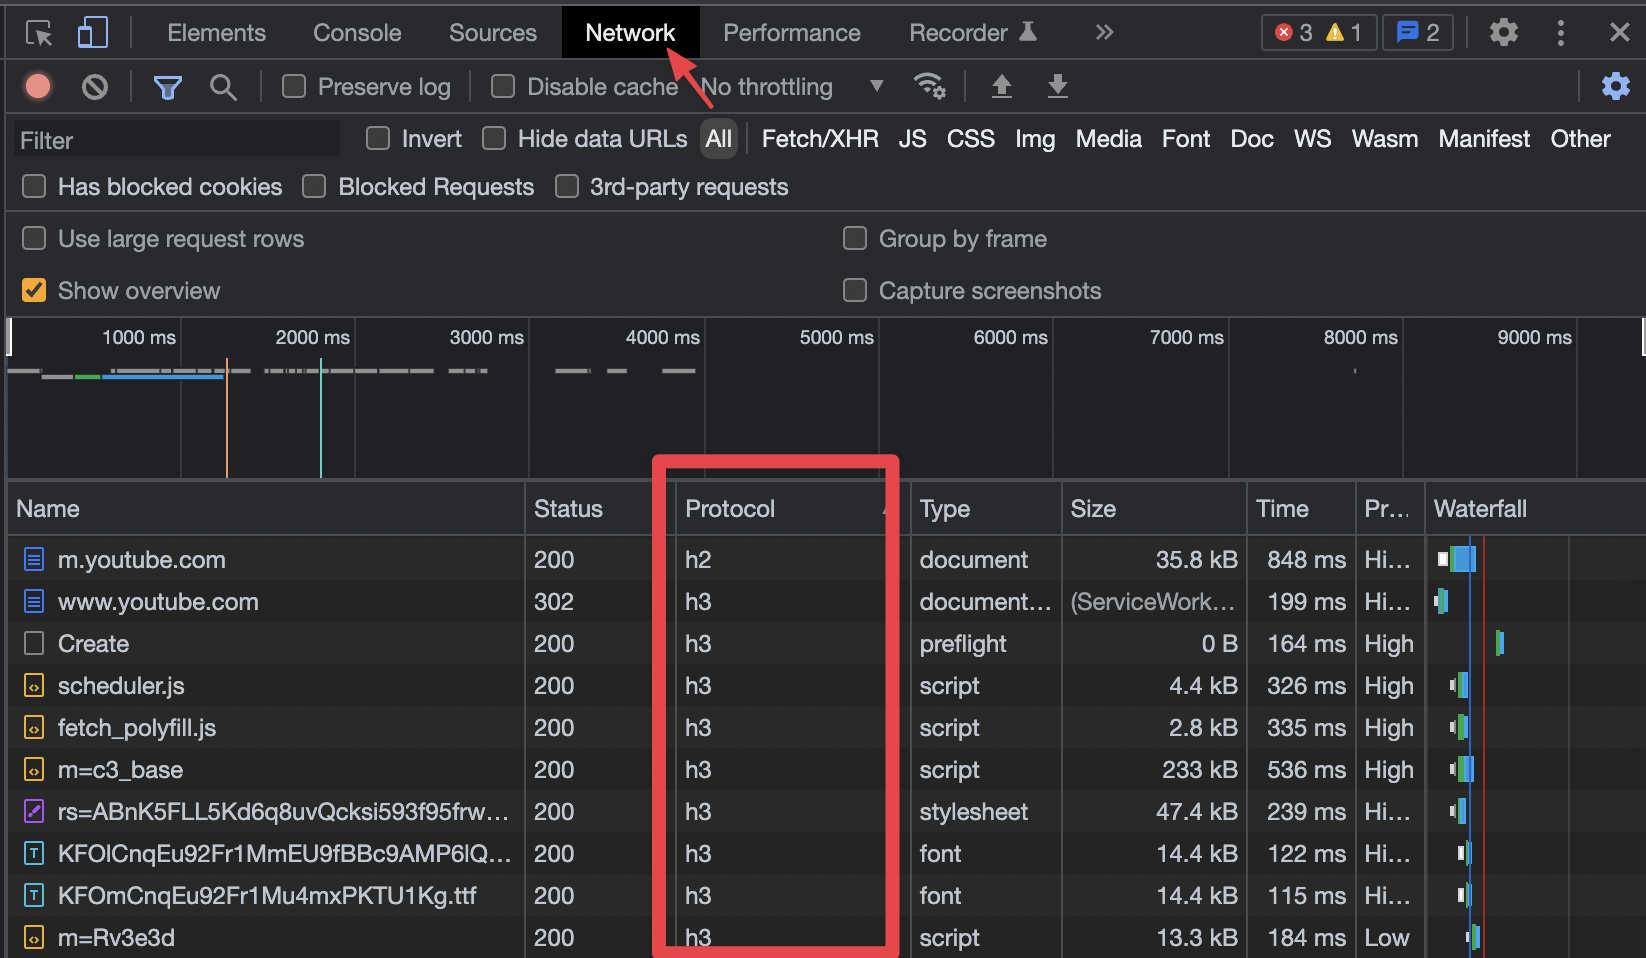
You can determine which protocol the resources loaded on the page are using, such as HTTP/1 or HTTP/2, as follows. I can see that YouTube is using HTTP/3 as you can see in the example below:
11. File Types
You can analyze the resources loaded on the page with Chrome. For example, you can see only the resources for images by checking the "Img" field or only CSS files by checking the "CSS" fields. Of course, it will not be very healthy to analyze all your images in this way, it may be more efficient to check the image elements you specifically select:
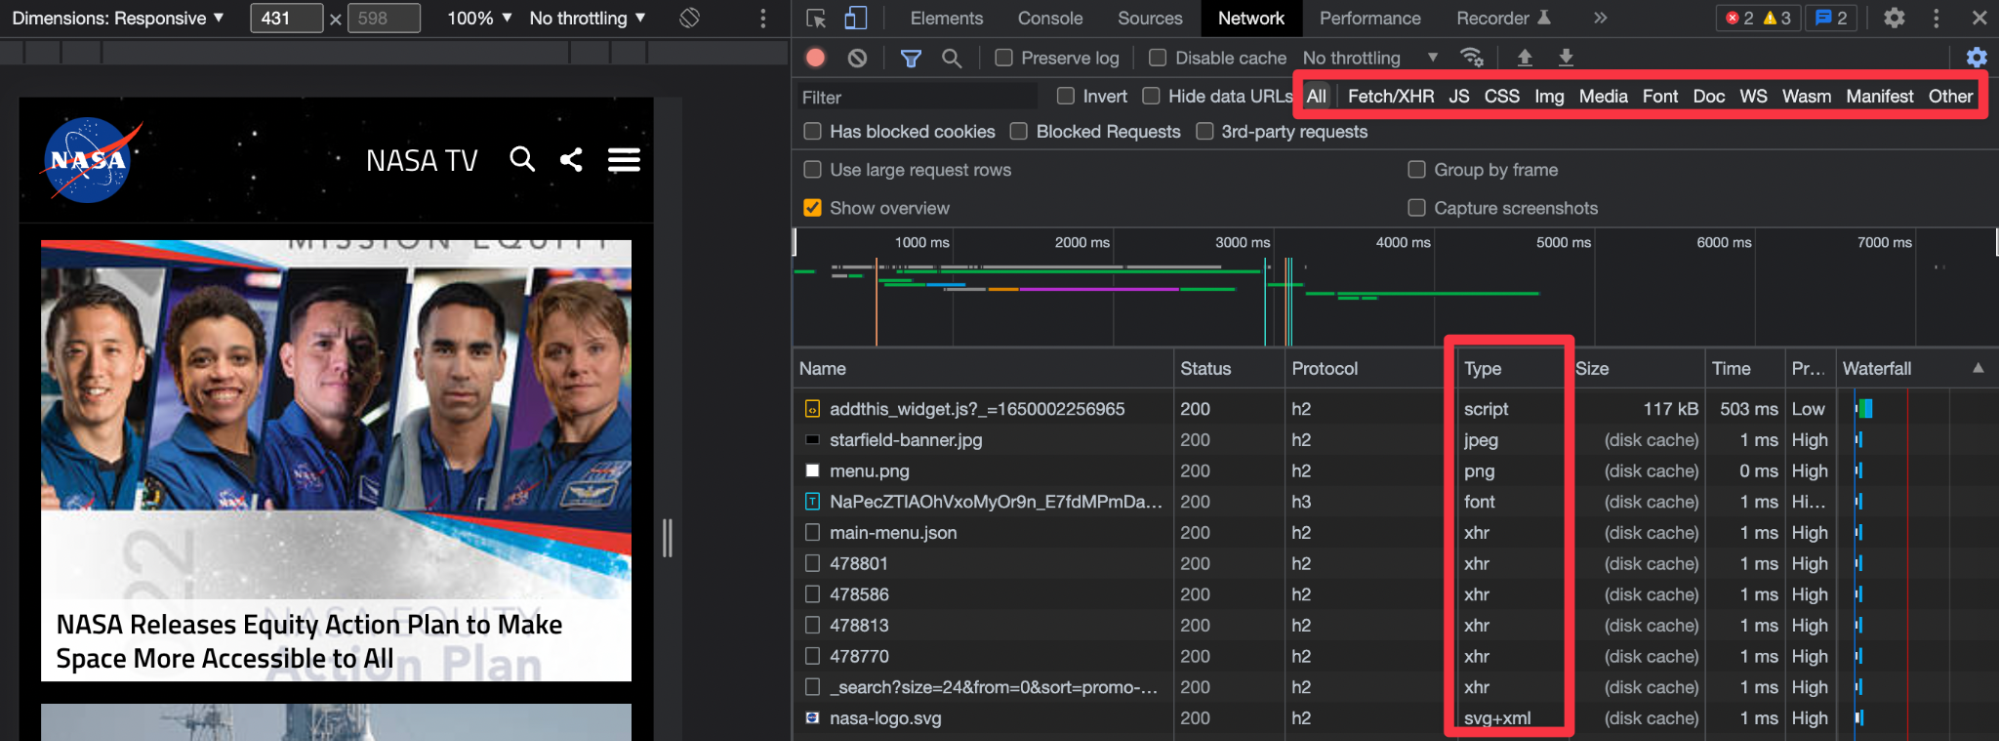
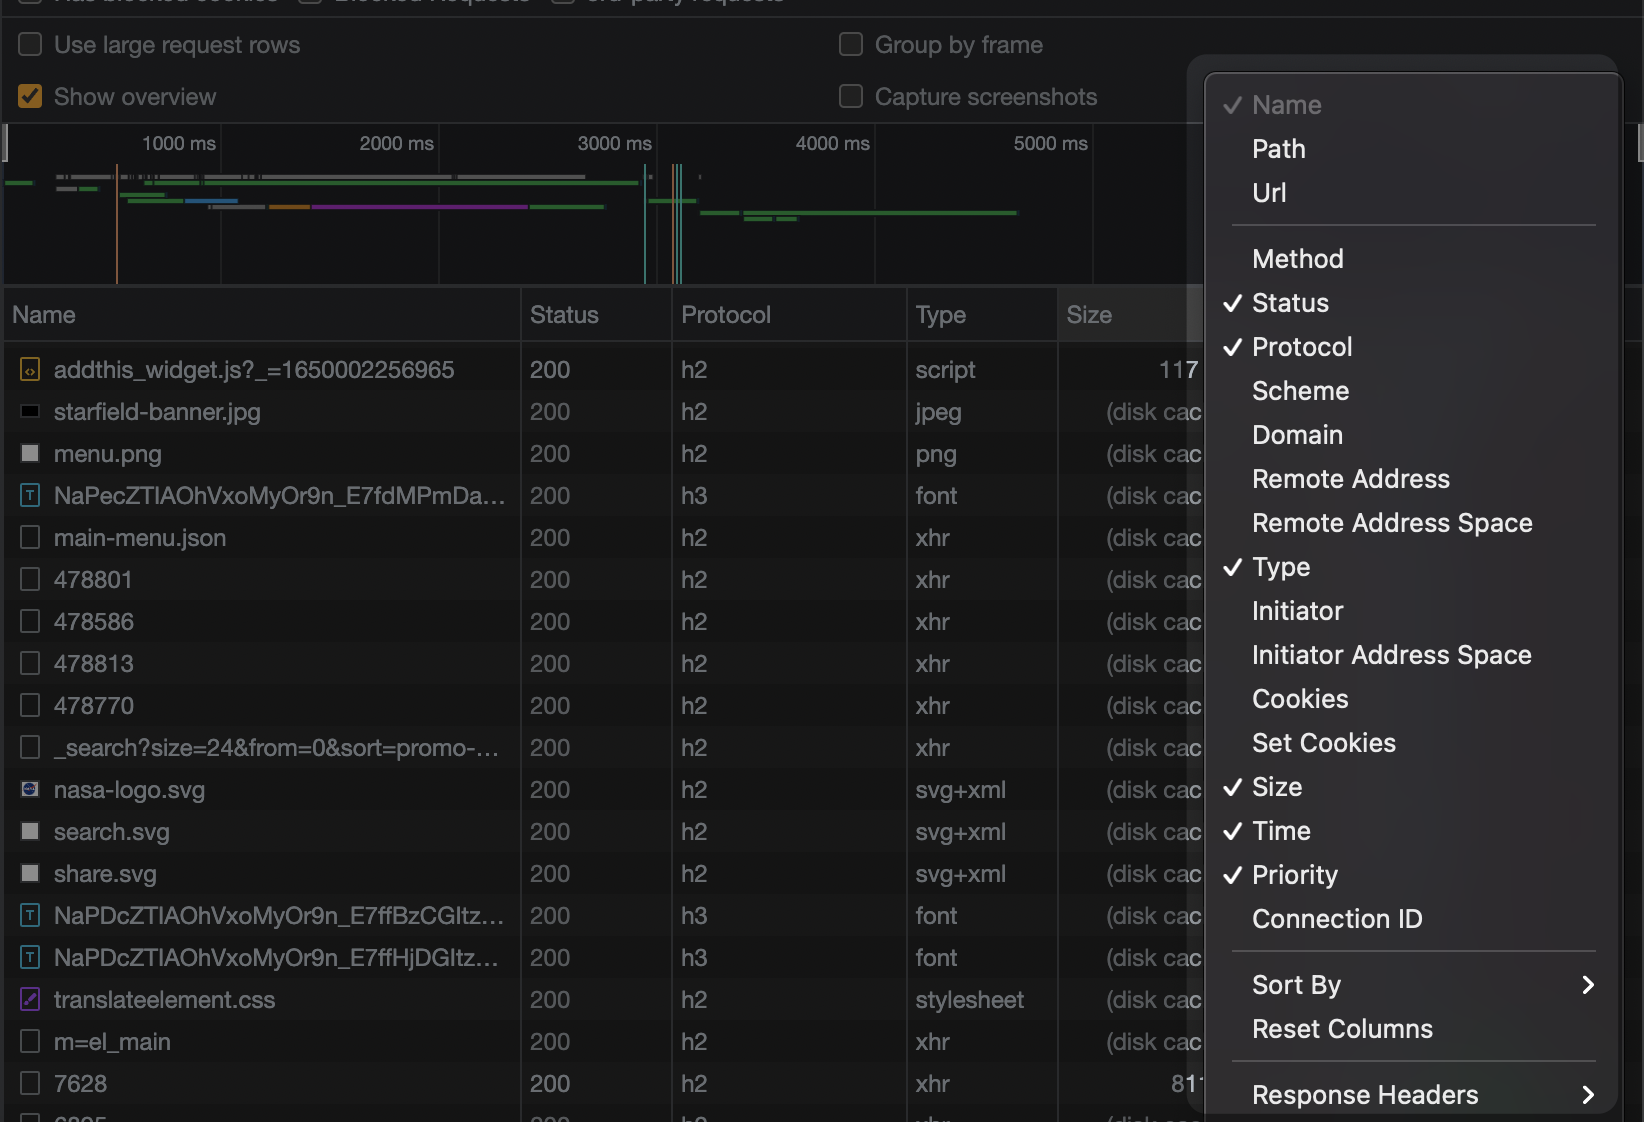
If the "Type" or "Protocol" sections in the article do not appear in your version of Chrome, you can turn on and off the fields you want from the area below:
12. CSS Code Review
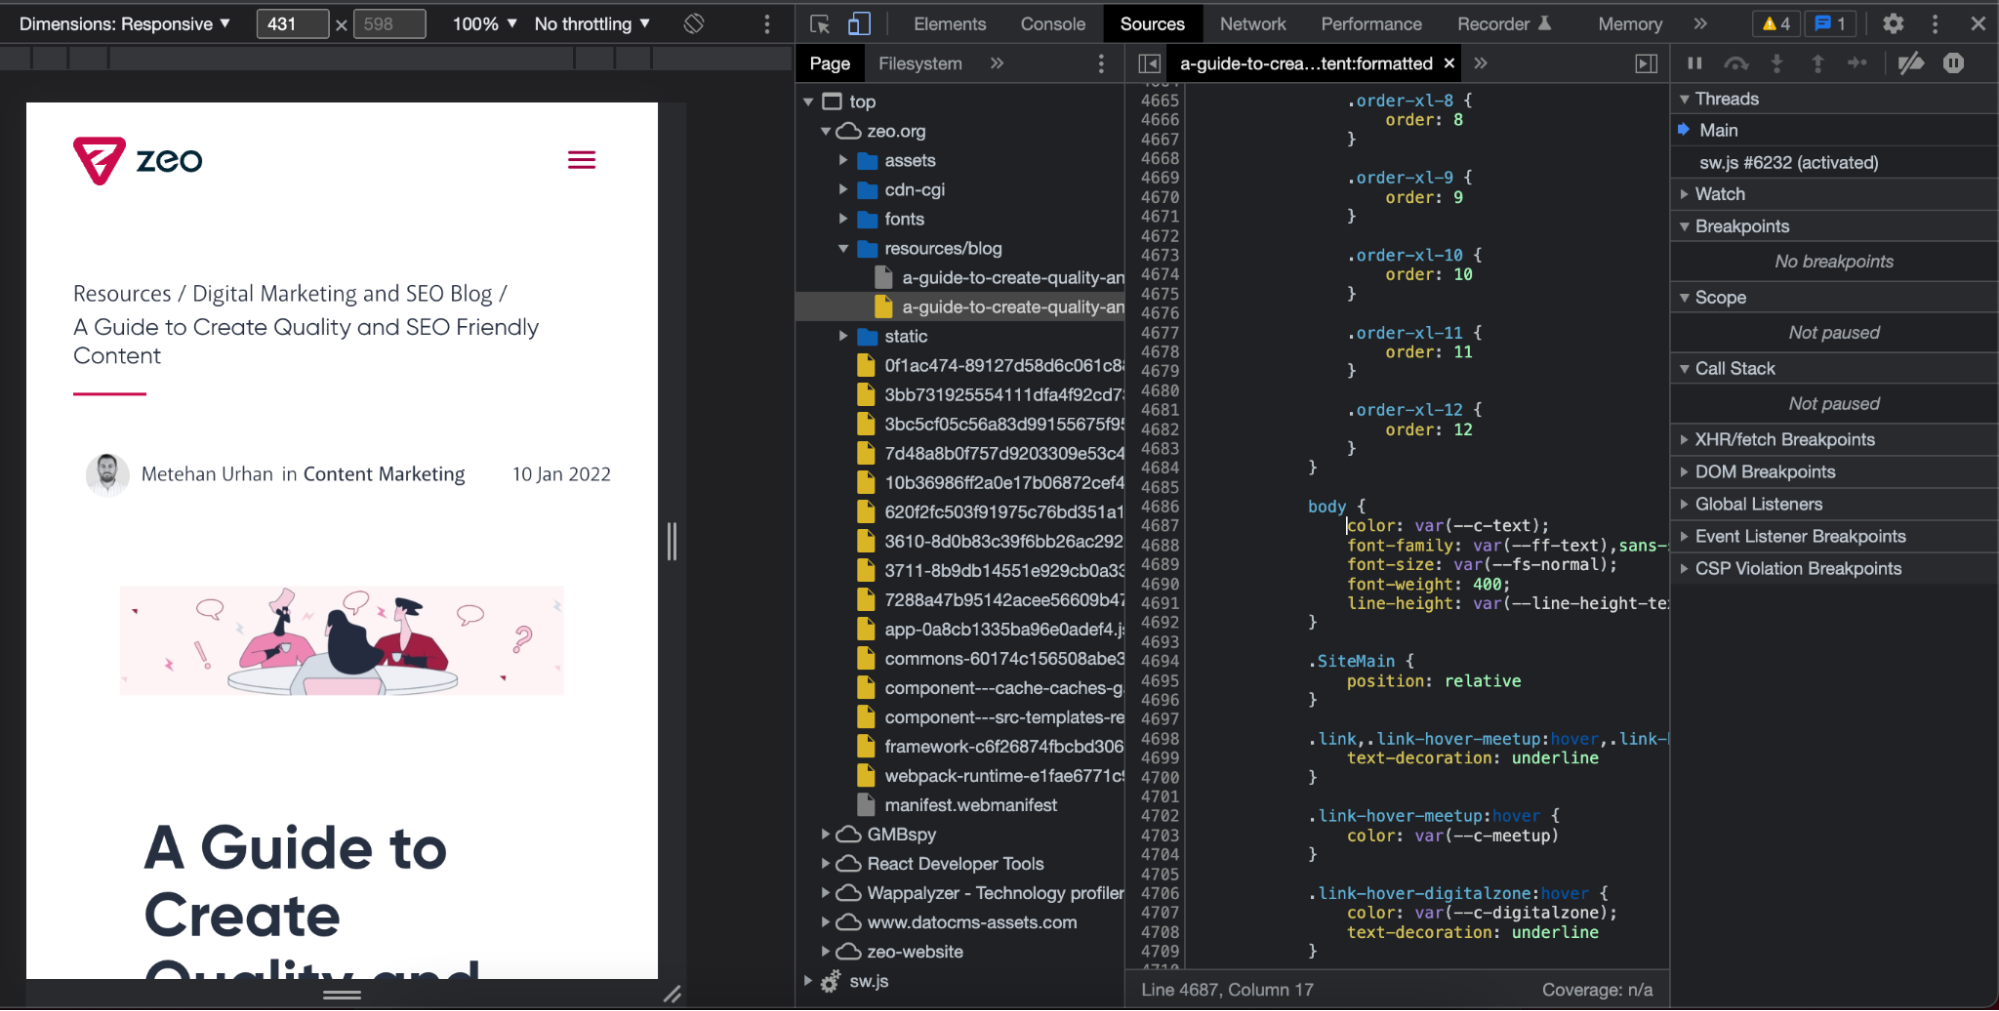
The subtitle may not be quite right, but you can directly access the CSS file in the styles field to examine that file by selecting the desired field in the elements section:

You can directly access the relevant CSS code area and if you need to make edits, you can start from this section:
13. Writing to the Console
If you want to spice things up a bit more, you can write the text you want in the Console section with the code below:

console.log('%cHello world', 'font-size:40px;color:#fff;text-shadow:0 1px 0 #ccc,0 2px 0 #c9c9c9,0 3px 0 #bbb,0 4px 0 #b9b9b9,0 5px 0 #aaa,0 6px 1px rgba(0,0,0,.1),0 0 5px rgba(0,0,0,.1),0 1px 3px rgba(0,0,0,.3),0 3px 5px rgba(0,0,0,.2),0 5px 10px rgba(0,0,0,.25),0 10px 10px rgba(0,0,0,.2),0 20px 20px rgba(0,0,0,.15);');
14. Disabling Javascript
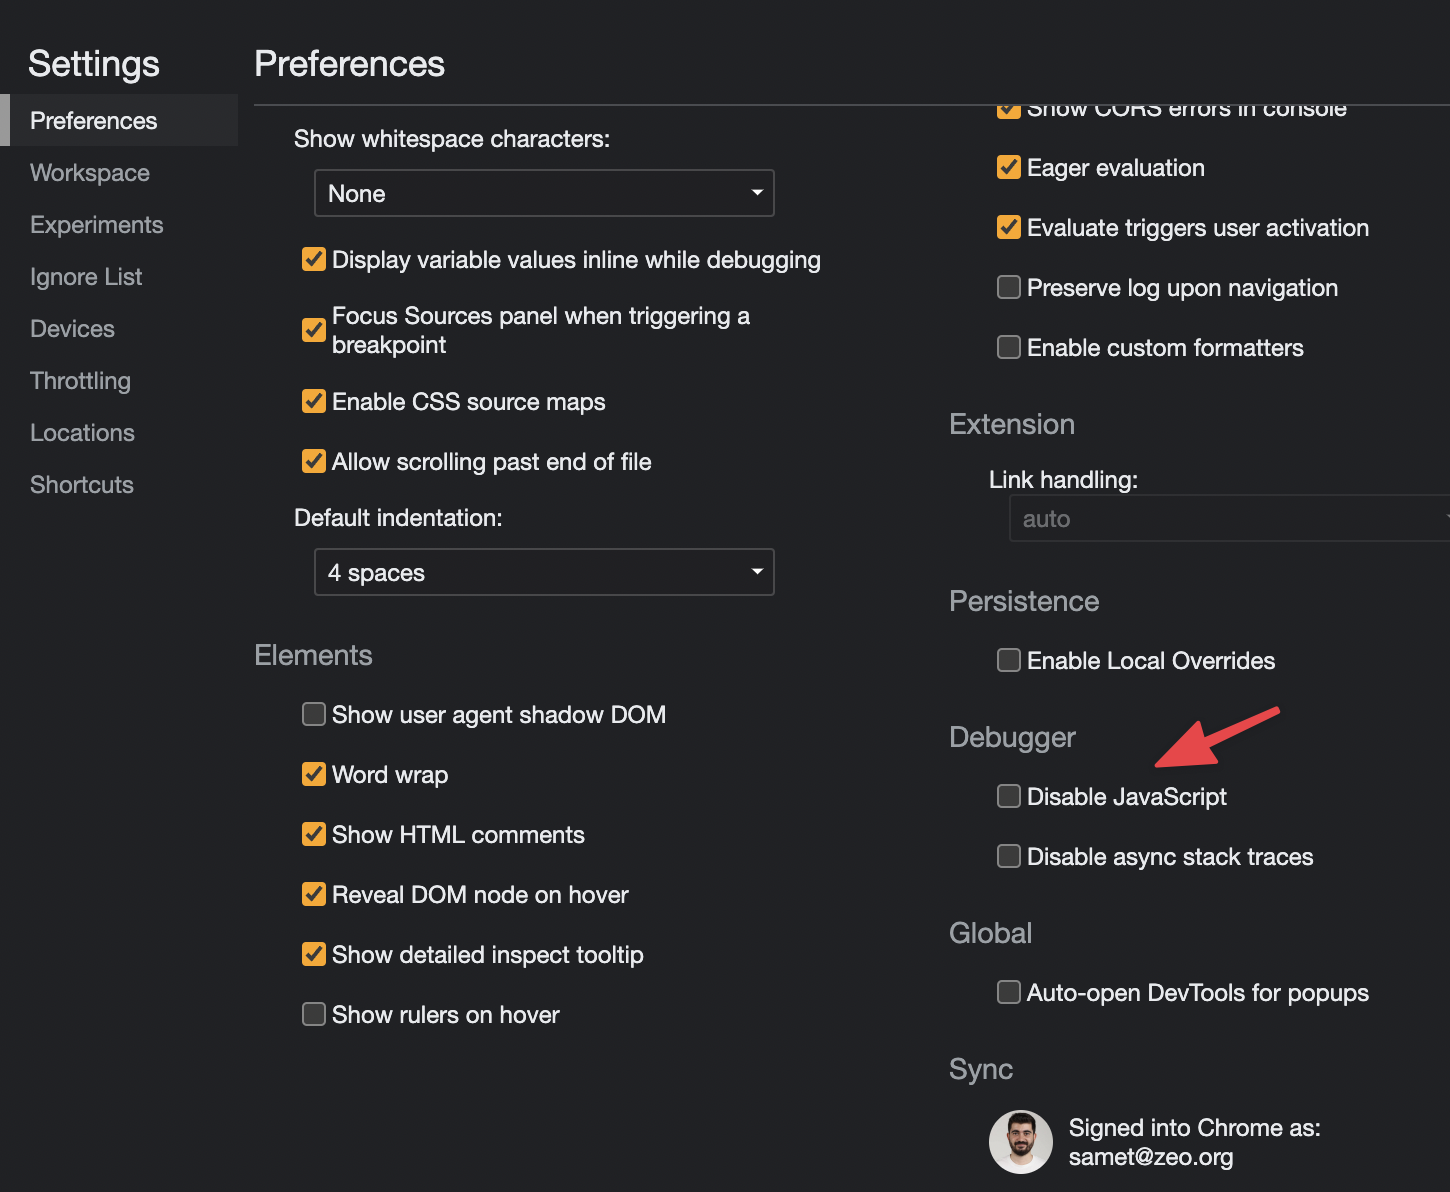
If you want to disable JS on pages, you can disable Javascript by following the steps below:
15. Unused CSS & JS Codes
Cleaning unnecessary CSS codes and lighter CSS structure is very important, especially in your Core Web Vitals analysis. The heavy size of these files causes serious problems with page speeds.
The red area in the image below shows the codes that are not used or that we can define as unnecessary. Each line shows the total bytes and how much of the code is not used during rendering. Of course, this information does not mean that you can remove 90% of the files! It is better to carefully examine the code and remove it:
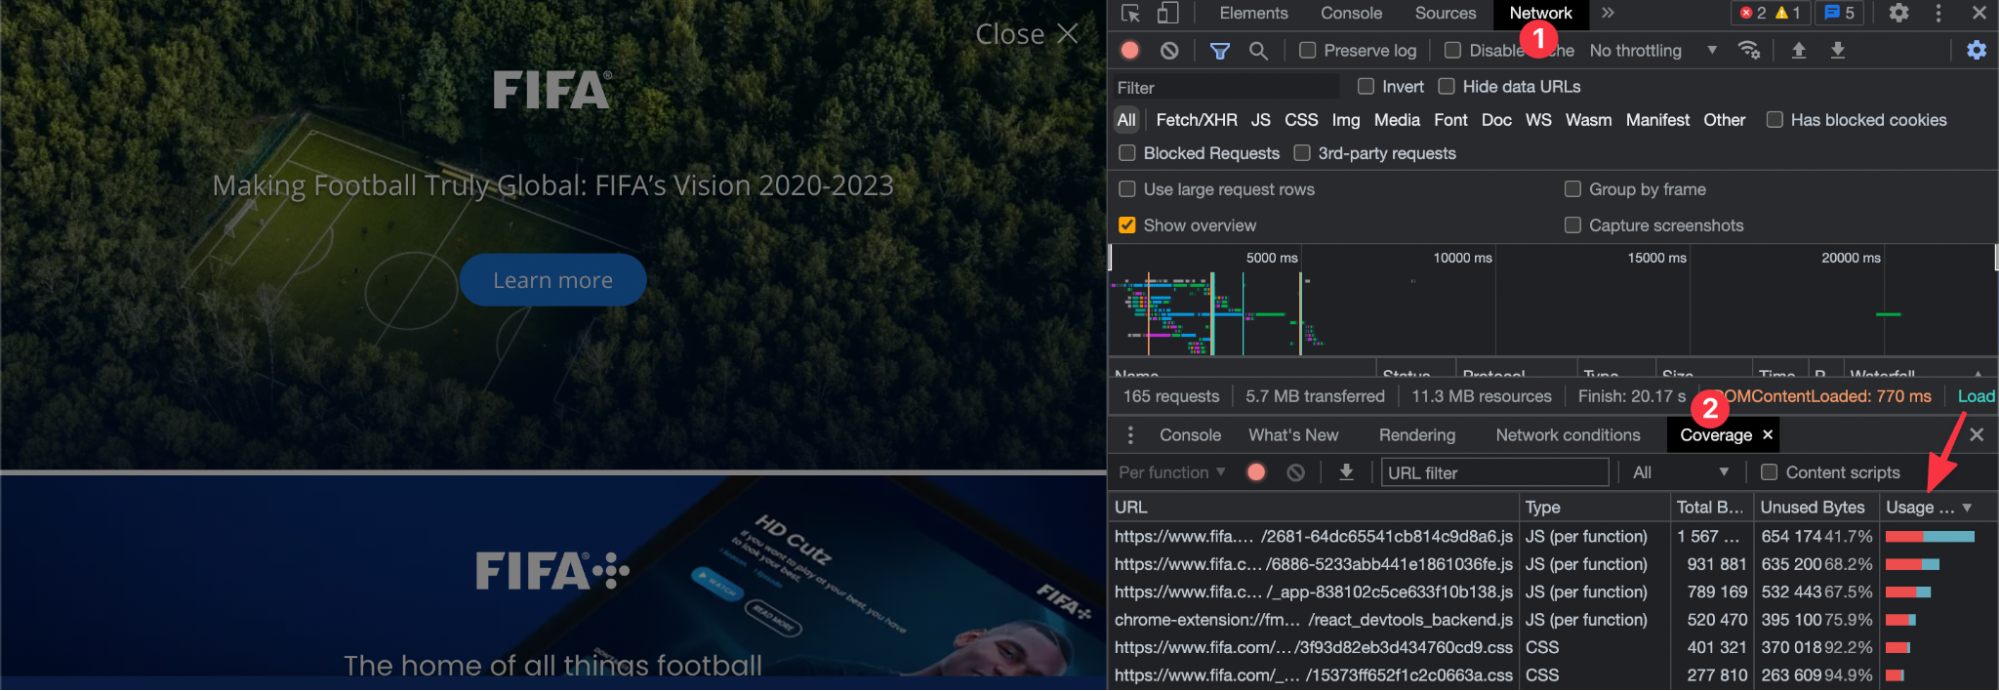
Double-click on the file to see the red and unnecessary codes:
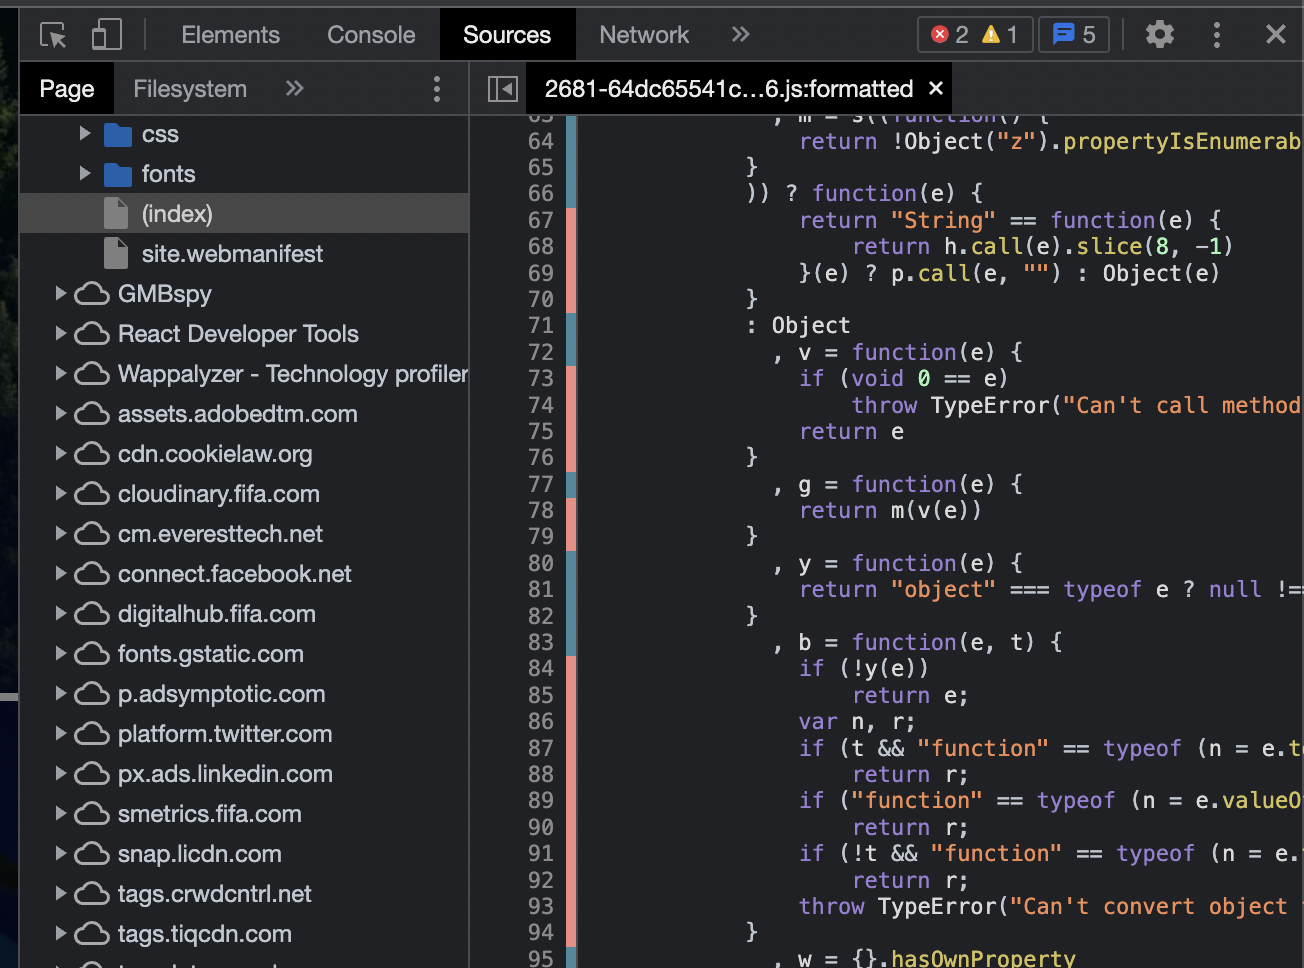
This allows you to create lighter CSS and Javascript files.
16. Rendering
In the Rendering section, you can instantly see the CWV values of the page:
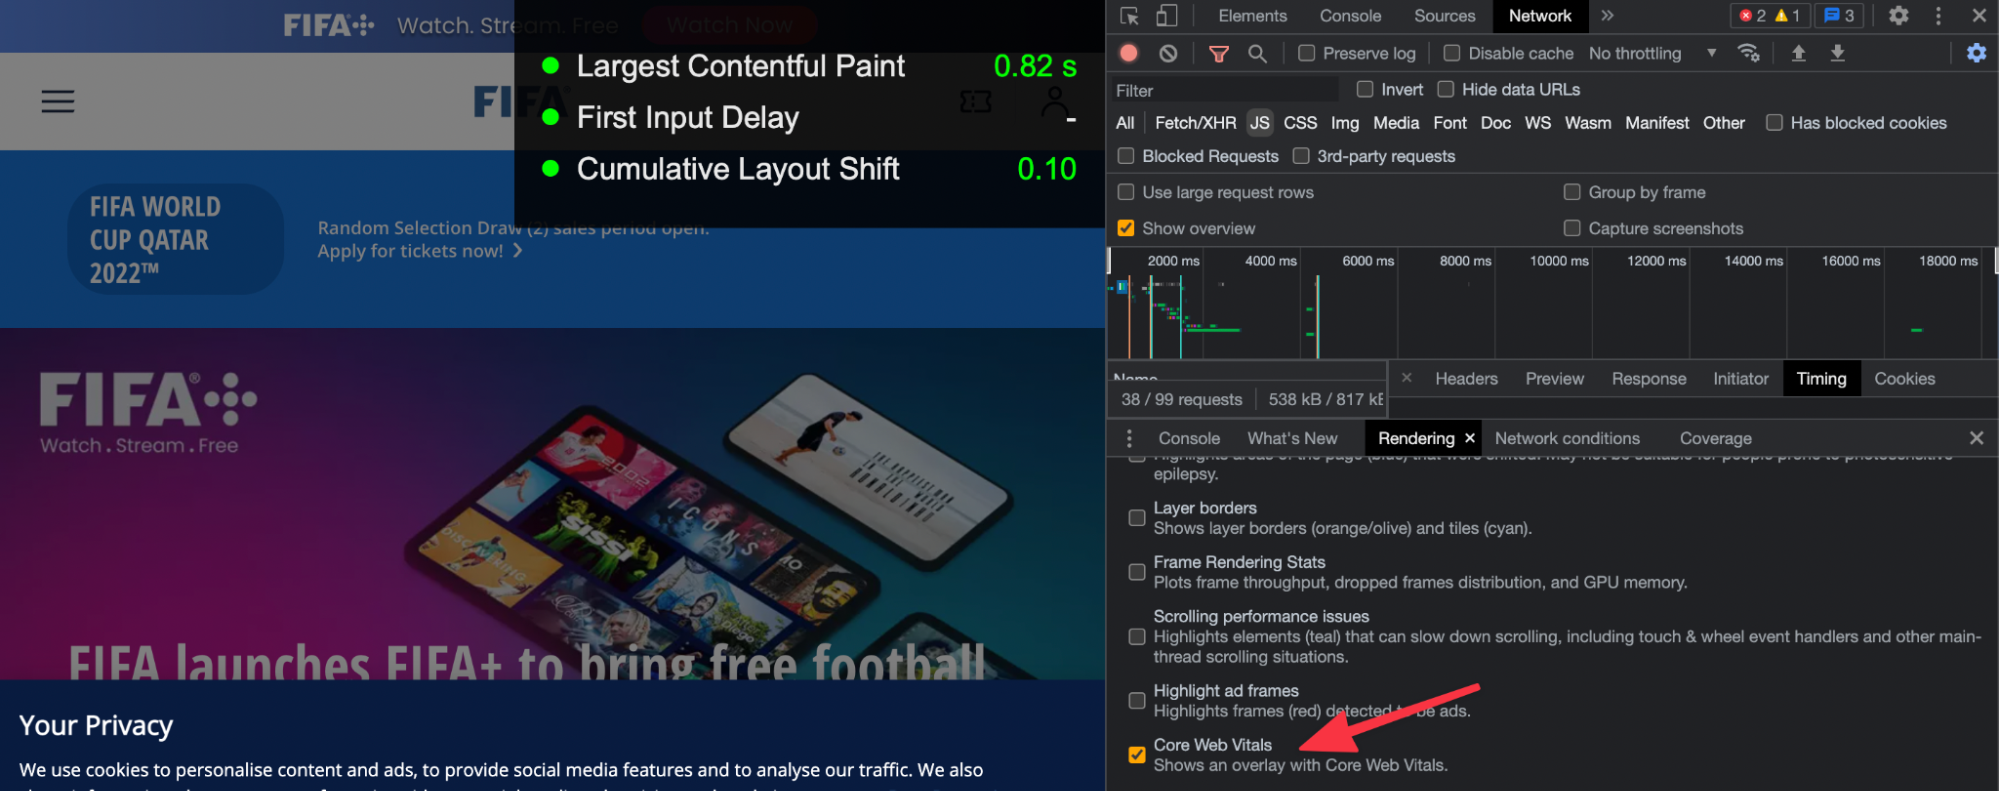
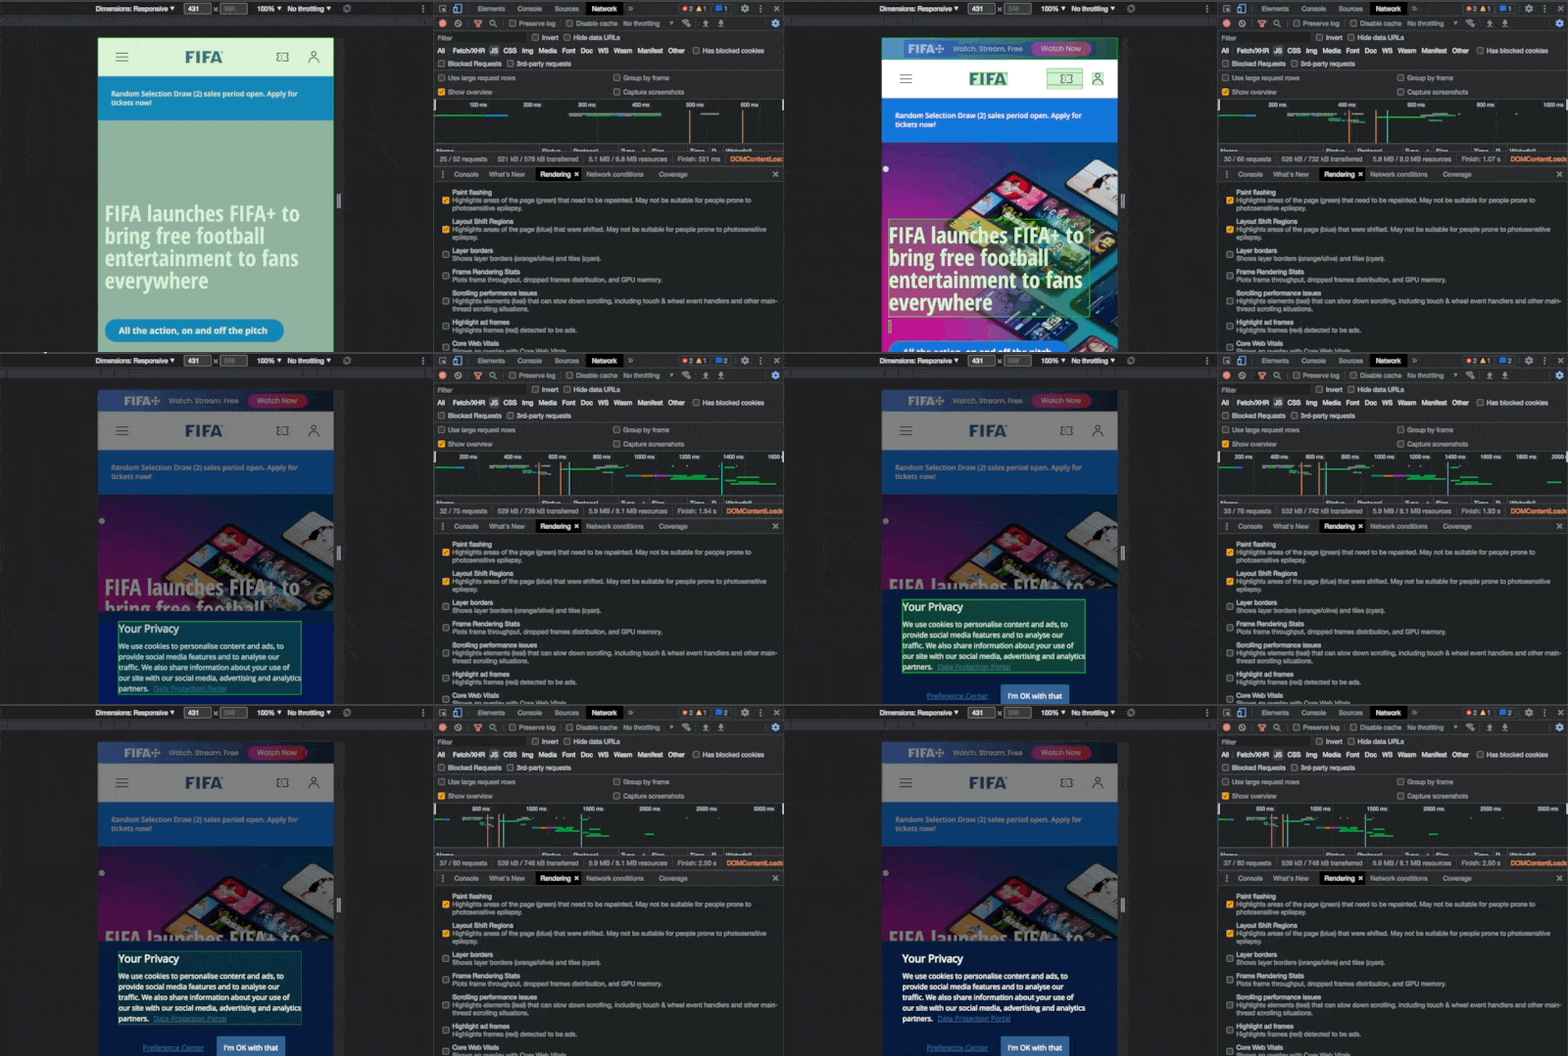
You can also identify changes such as CLS and create action plans for improvements.
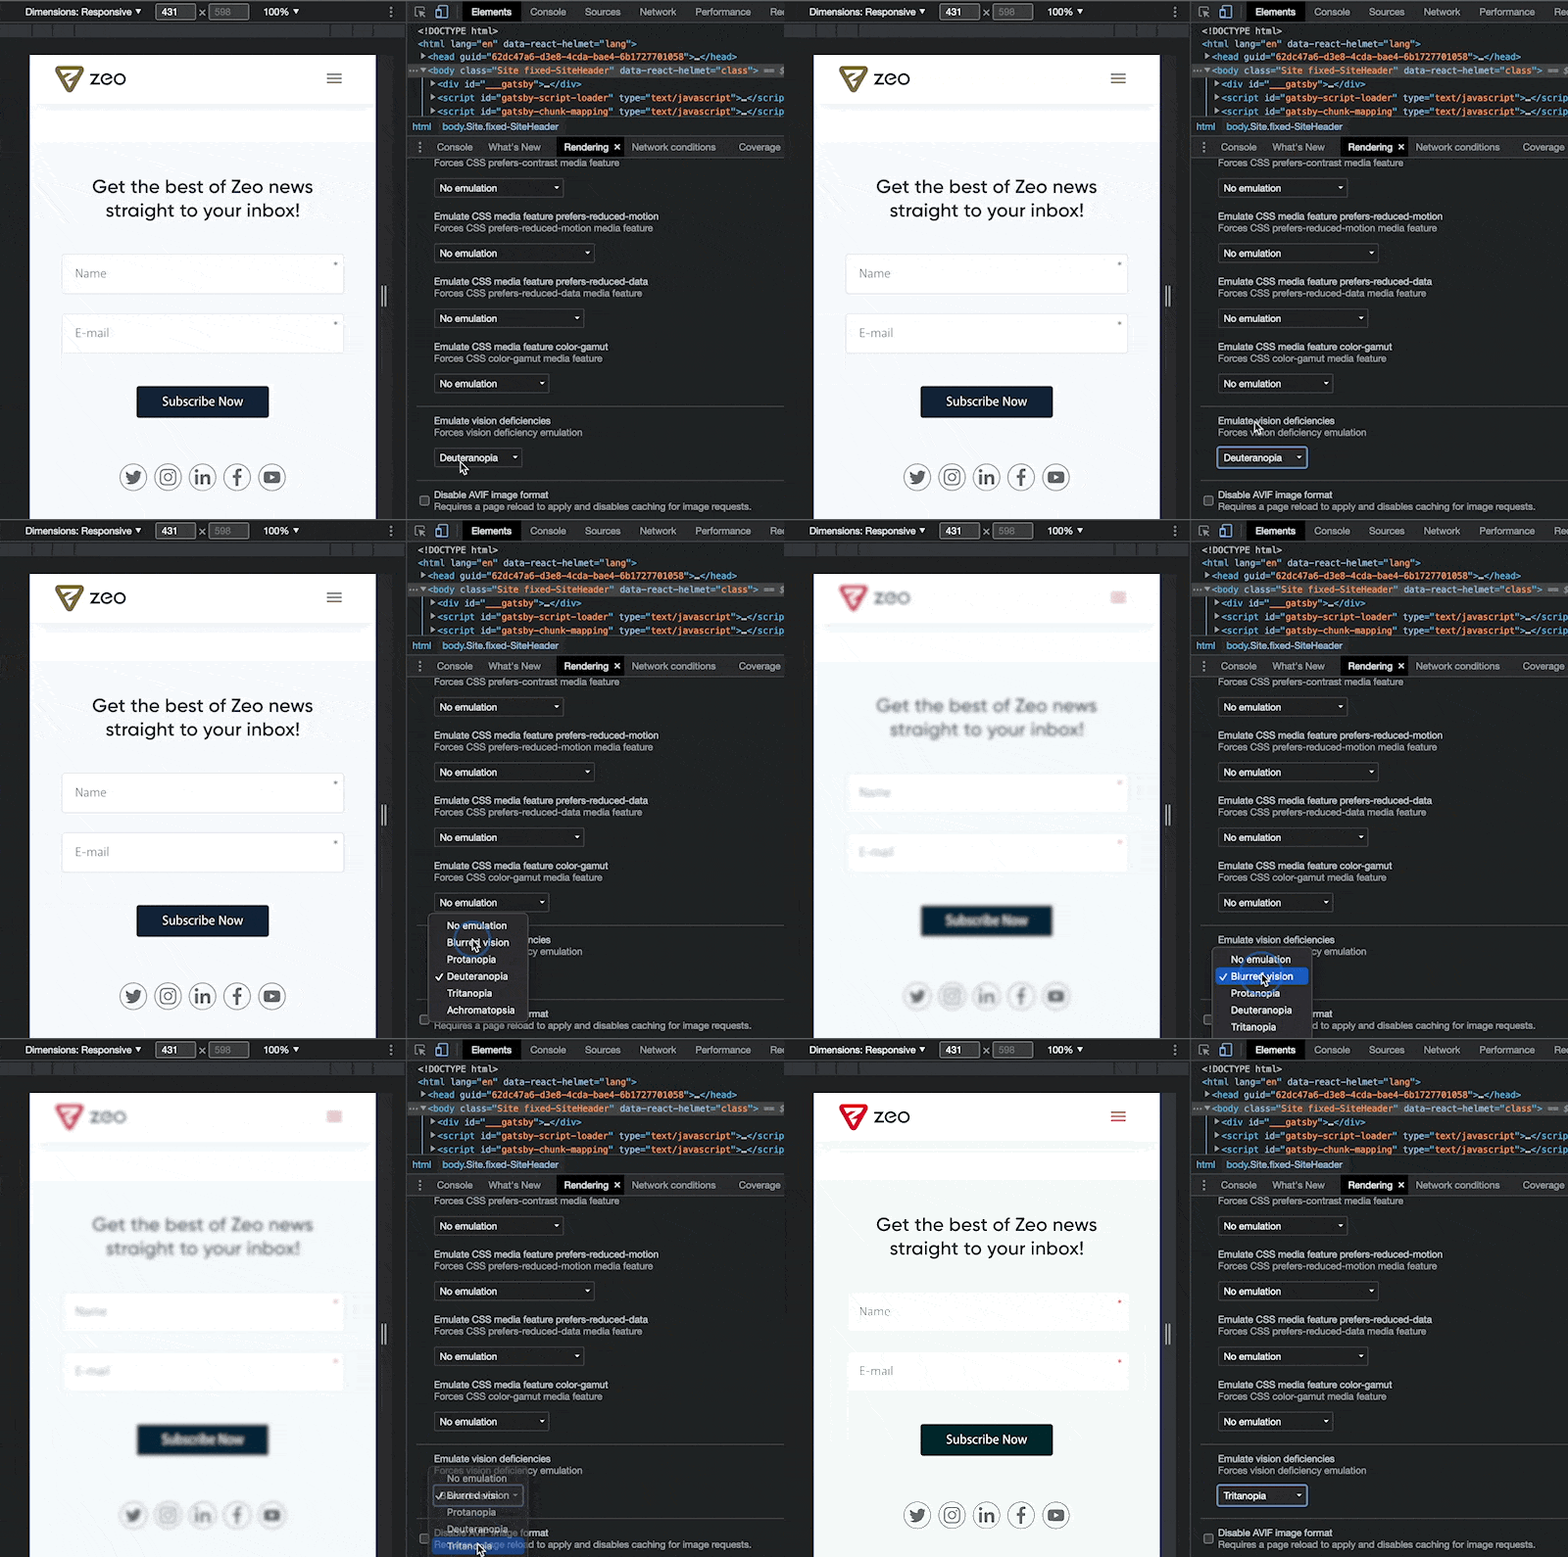
You can improve accessibility by addressing visual impairments. So you can be accessible to as many people as possible:
17. Block Requests
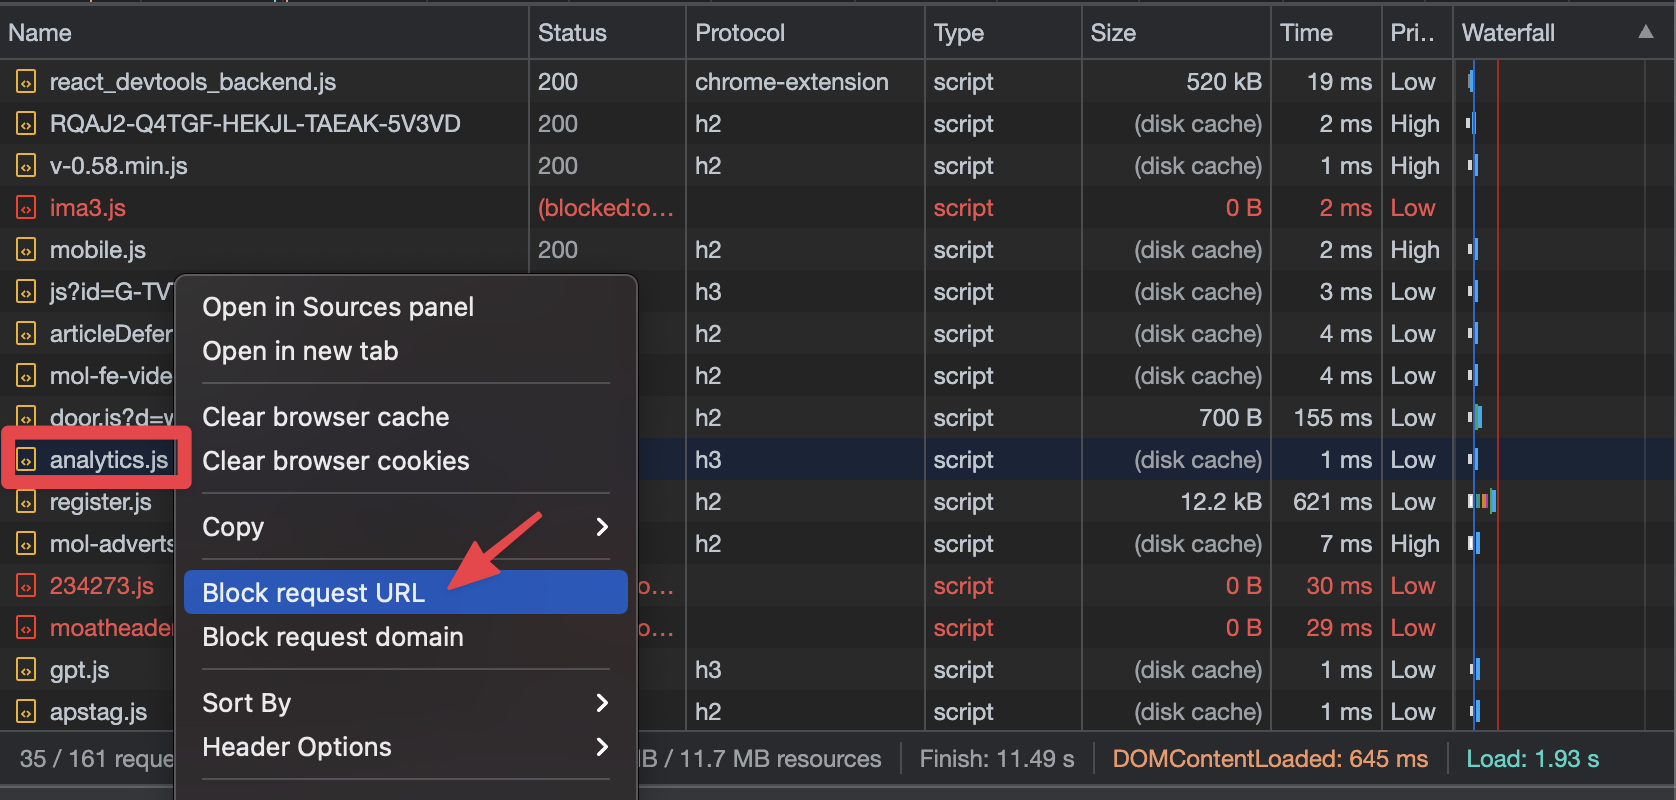
With Chrome, you can see how pages look without CSS or JavaScript and how much weight these files add. For example, when you block a resource, you can see how the page load will be, or what parts of the interface may have changed with DevTools. You can do this by checking the "Block request URL" section:
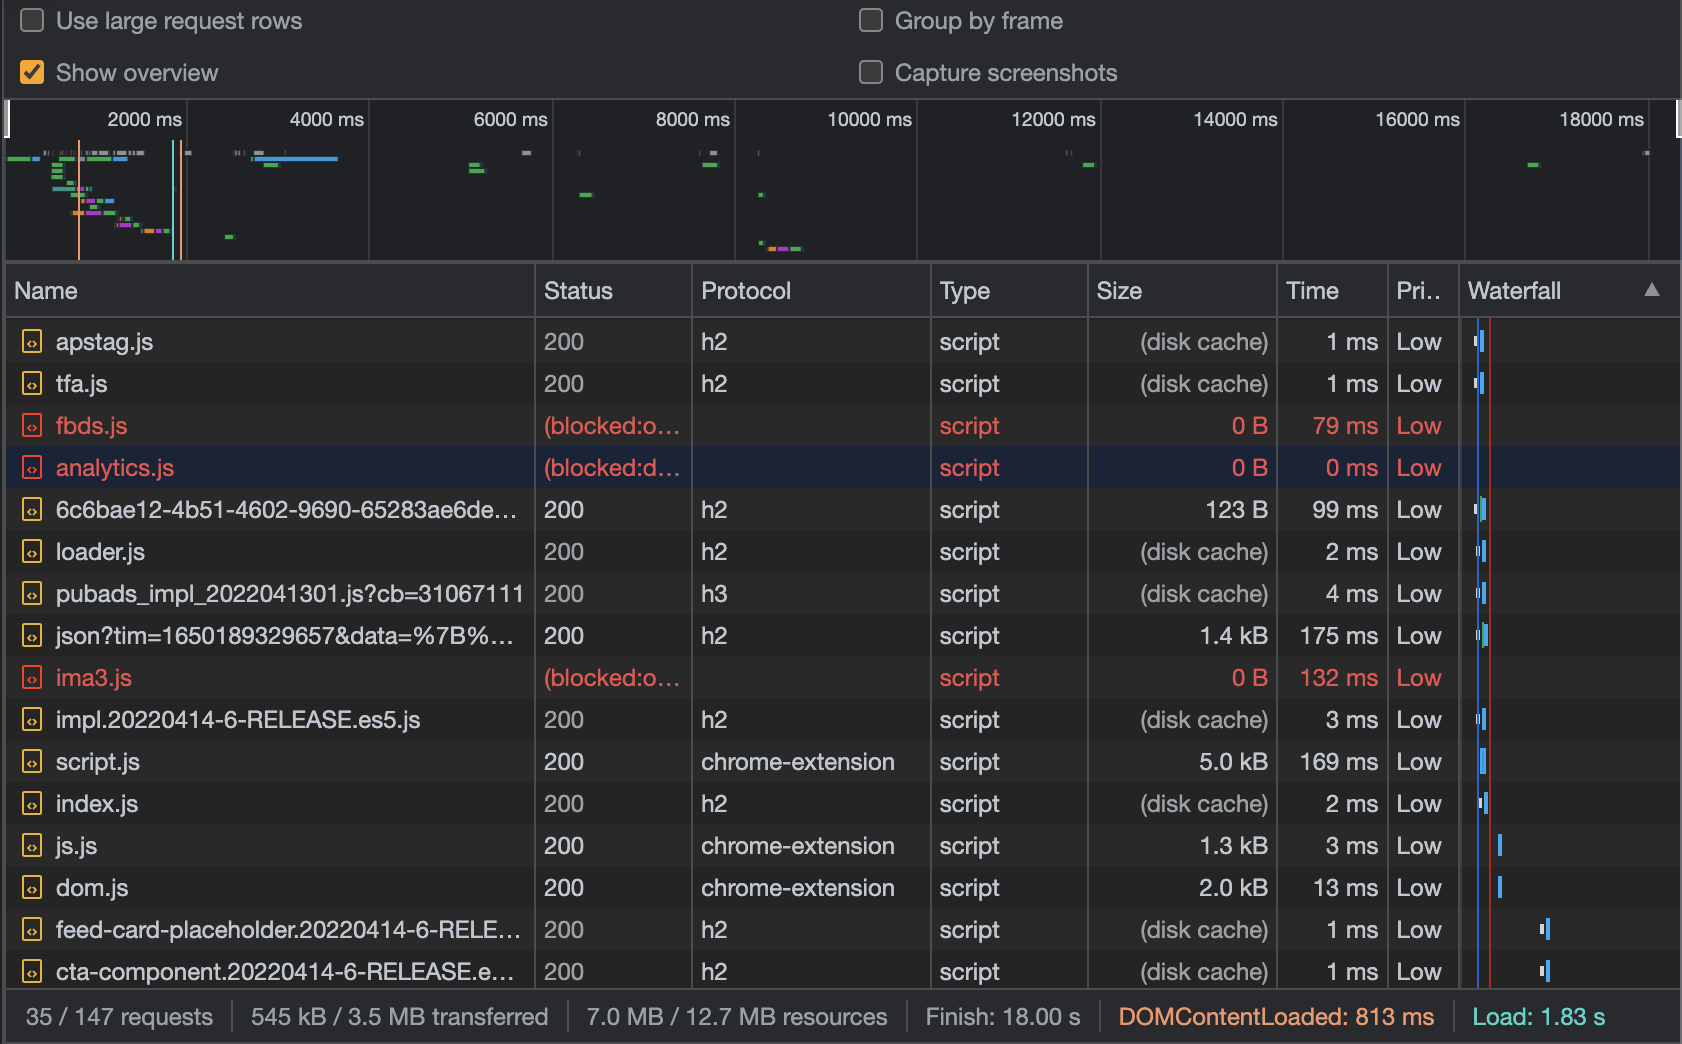
You can then measure changes in parts such as page request numbers and Load:
18. Screenshots
From this section, you can see what kind of screenshots occur on the page at which second. this way you can examine in more detail when optimizing values such as FID:

You can quickly switch between screenshots:

19. Core Web Vitals
You can detect values such as FCP, FID, or LCP in Chrome. In the screenshot below, for example, you can see the information for the FCP value.

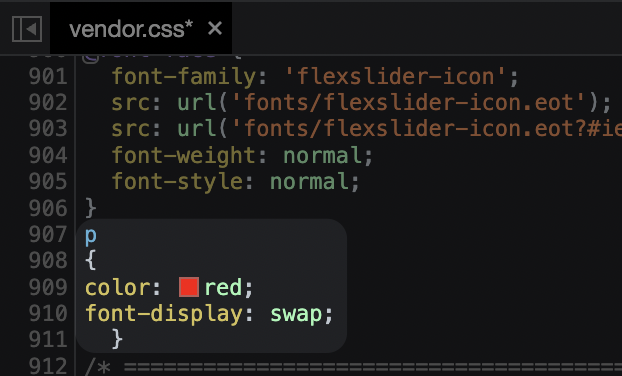
To optimize CWV values, you can, for example, apply font-display to font files live in Chrome:
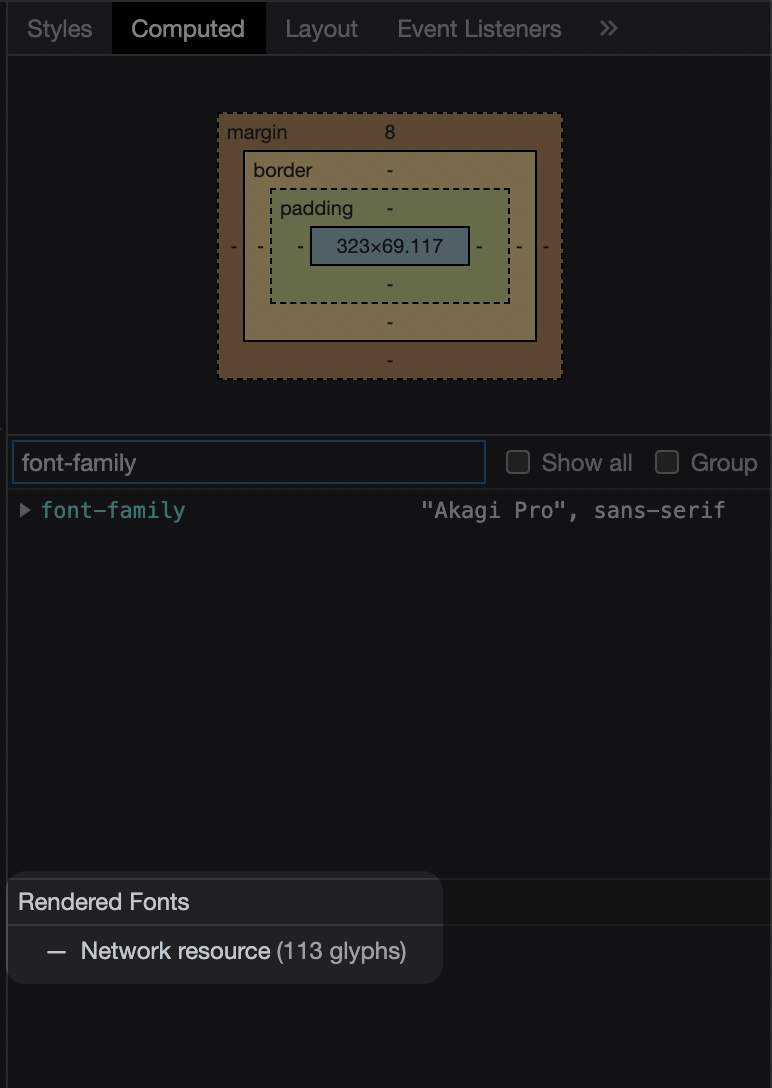
You can do the following to determine which font the text uses:
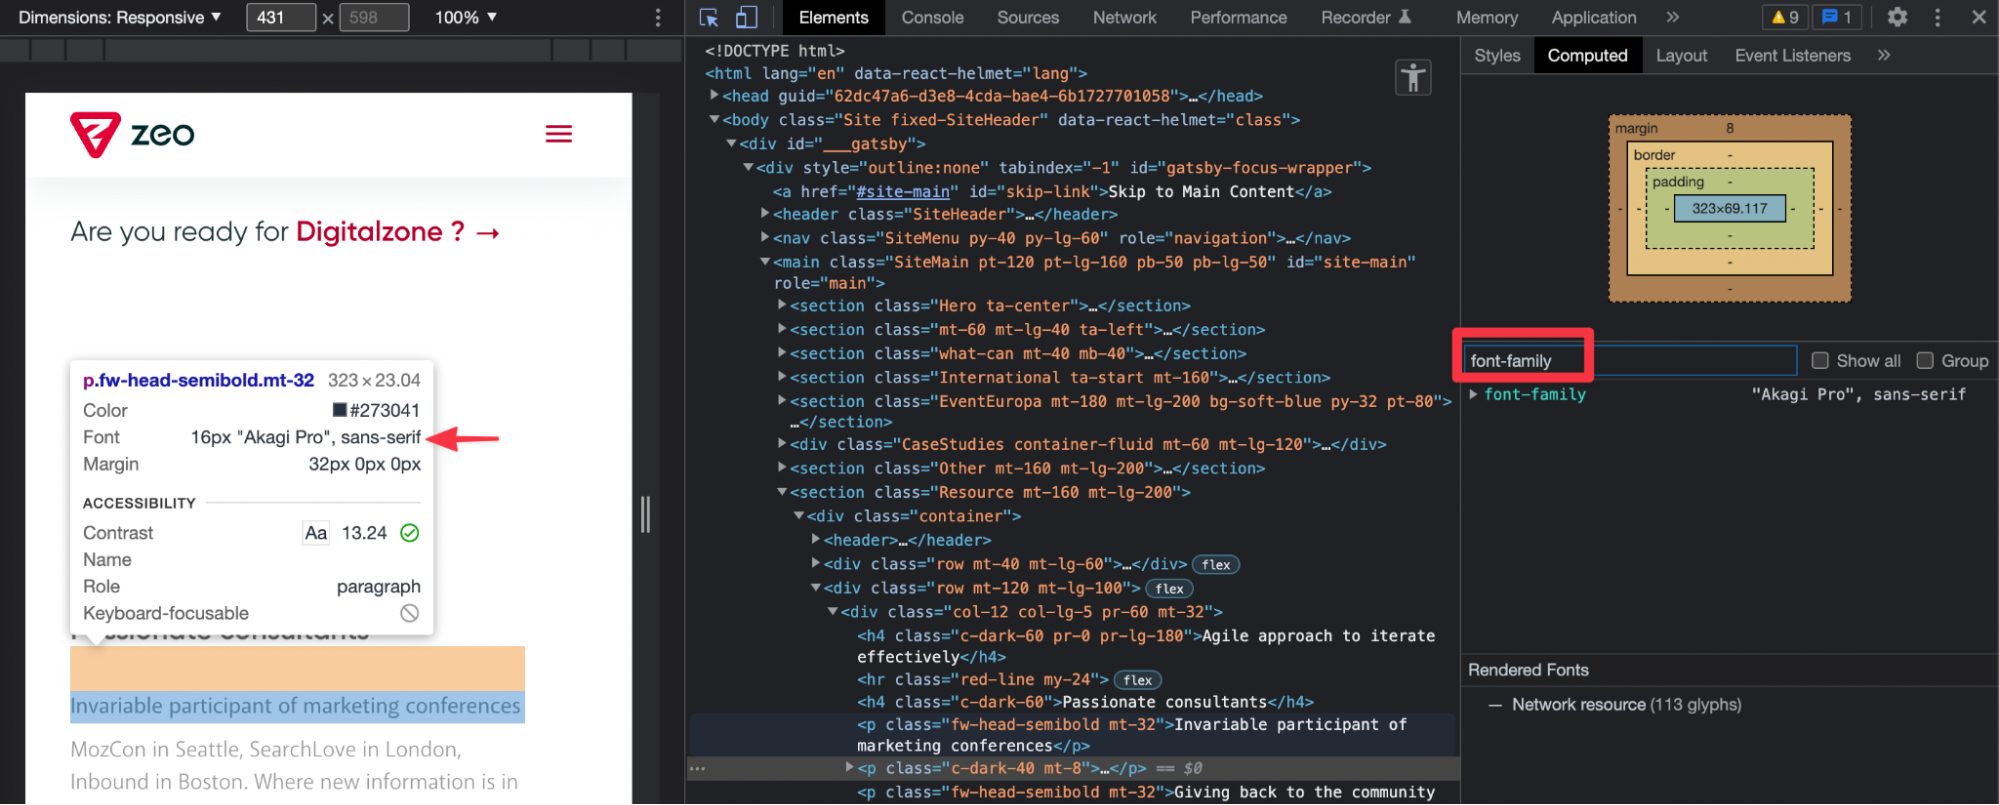
You can see how many glyphs the font file uses here:
20. Security
You can see problems with SSL certificates in the "Security" panel. With DevTools, you can see if the page is insecure because of HTTP sources, and you can easily detect these sources as well:

All the options you can use are not limited to the ones in this article, there are many more methods and new ones are being added as Chrome evolves.
As I conclude this article, I would like to point out that you should use Chrome DevTools very well, especially for in-depth analysis in the field of Technical SEO. In this way, you can also meet with software teams on common ground and take action.


